by Sebastian Saemann | May 27, 2020 | Kubernetes, Tutorials
Monitoring – for many a certain love-hate relationship. Some like it, others despise it. I am one of those who tend to despise it, but then grumble when you can’t see certain metrics and information. Regardless of personal preferences on the subject, however, the consensus of everyone is certain: monitoring is important and a setup is only as good as the monitoring that goes with it.
Anyone who wants to develop and operate their applications on the basis of Kubernetes will inevitably ask themselves sooner or later how they can monitor these applications and the Kubernetes cluster. One variant is the use of the monitoring solution Prometheus; more precisely, by using the Kubernetes Prometheus Operator. An exemplary and functional solution is shown in this blog post.
Kubernetes Operator
Kubernetes operators are, in short, extensions that can be used to create your own resource types. In addition to the standard Kubernetes resources such as Pods, DaemonSets, Services, etc., you can also use your own resources with the help of an operator. In our example, the following are new: Prometheus, ServiceMonitor and others. Operators are of great use when you need to perform special manual tasks for your application in order to run it properly. This could be, for example, database schema updates during version updates, special backup jobs or controlling events in distributed systems. As a rule, operators – like ordinary applications – run as containers within the cluster.
How does it work?
The basic idea is that the Prometheus Operator is used to start one or many Prometheus instances, which in turn are dynamically configured by the ServiceMonitor. This means that an ordinary Kubernetes service can be docked with a ServiceMonitor, which in turn can also read out the endpoints and configure the associated Prometheus instance accordingly. If the service or the endpoints change, for example in number or the endpoints have new IPs, the ServiceMonitor recognises this and reconfigures the Prometheus instance each time. In addition, a manual configuration can also be carried out via configmaps.
Requirements
The prerequisite is a functioning Kubernetes cluster. For the following example, I use an NWS Managed Kubernetes Cluster in version 1.16.2.
Installation of Prometheus Operator
First, the Prometheus operator is provided. A deployment, a required ClusterRole with associated ClusterRoleBinding and a ServiceAccount are defined.
apiVersion: rbac.authorization.k8s.io/v1
kind: ClusterRoleBinding
metadata:
  labels:
    app.kubernetes.io/component: controller
    app.kubernetes.io/name: prometheus-operator
    app.kubernetes.io/version: v0.38.0
  name: prometheus-operator
roleRef:
  apiGroup: rbac.authorization.k8s.io
  kind: ClusterRole
  name: prometheus-operator
subjects:
- kind: ServiceAccount
  name: prometheus-operator
  namespace: default
---
apiVersion: rbac.authorization.k8s.io/v1
kind: ClusterRole
metadata:
  labels:
    app.kubernetes.io/component: controller
    app.kubernetes.io/name: prometheus-operator
    app.kubernetes.io/version: v0.38.0
  name: prometheus-operator
rules:
- apiGroups:
  - apiextensions.k8s.io
  resources:
  - customresourcedefinitions
  verbs:
  - create
- apiGroups:
  - apiextensions.k8s.io
  resourceNames:
  - alertmanagers.monitoring.coreos.com
  - podmonitors.monitoring.coreos.com
  - prometheuses.monitoring.coreos.com
  - prometheusrules.monitoring.coreos.com
  - servicemonitors.monitoring.coreos.com
  - thanosrulers.monitoring.coreos.com
  resources:
  - customresourcedefinitions
  verbs:
  - get
  - update
- apiGroups:
  - monitoring.coreos.com
  resources:
  - alertmanagers
  - alertmanagers/finalizers
  - prometheuses
  - prometheuses/finalizers
  - thanosrulers
  - thanosrulers/finalizers
  - servicemonitors
  - podmonitors
  - prometheusrules
  verbs:
  - '*'
- apiGroups:
  - apps
  resources:
  - statefulsets
  verbs:
  - '*'
- apiGroups:
  - ""
  resources:
  - configmaps
  - secrets
  verbs:
  - '*'
- apiGroups:
  - ""
  resources:
  - pods
  verbs:
  - list
  - delete
- apiGroups:
  - ""
  resources:
  - services
  - services/finalizers
  - endpoints
  verbs:
  - get
  - create
  - update
  - delete
- apiGroups:
  - ""
  resources:
  - nodes
  verbs:
  - list
  - watch
- apiGroups:
  - ""
  resources:
  - namespaces
  verbs:
  - get
  - list
  - watch
---
apiVersion: apps/v1
kind: Deployment
metadata:
  labels:
    app.kubernetes.io/component: controller
    app.kubernetes.io/name: prometheus-operator
    app.kubernetes.io/version: v0.38.0
  name: prometheus-operator
  namespace: default
spec:
  replicas: 1
  selector:
    matchLabels:
      app.kubernetes.io/component: controller
      app.kubernetes.io/name: prometheus-operator
  template:
    metadata:
      labels:
        app.kubernetes.io/component: controller
        app.kubernetes.io/name: prometheus-operator
        app.kubernetes.io/version: v0.38.0
    spec:
      containers:
      - args:
        - --kubelet-service=kube-system/kubelet
        - --logtostderr=true
        - --config-reloader-image=jimmidyson/configmap-reload:v0.3.0
        - --prometheus-config-reloader=quay.io/coreos/prometheus-config-reloader:v0.38.0
        image: quay.io/coreos/prometheus-operator:v0.38.0
        name: prometheus-operator
        ports:
        - containerPort: 8080
          name: http
        resources:
          limits:
            cpu: 200m
            memory: 200Mi
          requests:
            cpu: 100m
            memory: 100Mi
        securityContext:
          allowPrivilegeEscalation: false
      nodeSelector:
        beta.kubernetes.io/os: linux
      securityContext:
        runAsNonRoot: true
        runAsUser: 65534
      serviceAccountName: prometheus-operator
---
apiVersion: v1
kind: ServiceAccount
metadata:
  labels:
    app.kubernetes.io/component: controller
    app.kubernetes.io/name: prometheus-operator
    app.kubernetes.io/version: v0.38.0
  name: prometheus-operator
  namespace: default
---
apiVersion: v1
kind: Service
metadata:
  labels:
    app.kubernetes.io/component: controller
    app.kubernetes.io/name: prometheus-operator
    app.kubernetes.io/version: v0.38.0
  name: prometheus-operator
  namespace: default
spec:
  clusterIP: None
  ports:
  - name: http
    port: 8080
    targetPort: http
  selector:
    app.kubernetes.io/component: controller
    app.kubernetes.io/name: prometheus-operator
kubectl apply -f 00-prometheus-operator.yaml
clusterrolebinding.rbac.authorization.k8s.io/prometheus-operator created
clusterrole.rbac.authorization.k8s.io/prometheus-operator created
deployment.apps/prometheus-operator created
serviceaccount/prometheus-operator created
service/prometheus-operator created
Role Based Access Control
In addition, corresponding Role Based Access Control (RBAC) policies are required. The Prometheus instances (StatefulSets), started by the Prometheus operator, start containers under the service account of the same name “Prometheus”. This account needs read access to the Kubernetes API in order to be able to read out the information about services and endpoints later.
Clusterrole
apiVersion: rbac.authorization.k8s.io/v1beta1
kind: ClusterRole
metadata:
  name: prometheus
rules:
- apiGroups: [""]
  resources:
  - nodes
  - services
  - endpoints
  - pods
  verbs: ["get", "list", "watch"]
- apiGroups: [""]
  resources:
  - configmaps
  verbs: ["get"]
- nonResourceURLs: ["/metrics"]
  verbs: ["get"]
kubectl apply -f 01-clusterrole.yaml
clusterrole.rbac.authorization.k8s.io/prometheus created
ClusterRoleBinding
apiVersion: rbac.authorization.k8s.io/v1beta1
kind: ClusterRoleBinding
metadata:
  name: prometheus
roleRef:
  apiGroup: rbac.authorization.k8s.io
  kind: ClusterRole
  name: prometheus
subjects:
- kind: ServiceAccount
  name: prometheus
  namespace: default
kubectl apply -f 01-clusterrolebinding.yaml
clusterrolebinding.rbac.authorization.k8s.io/prometheus created
ServiceAccount
apiVersion: v1
kind: ServiceAccount
metadata:
  name: prometheus
kubectl apply -f 01-serviceaccount.yaml
serviceaccount/prometheus created
Monitoring Kubernetes Cluster Nodes
There are various metrics that can be read from a Kubernetes cluster. In this example, we will initially only look at the system values of the Kubernetes nodes. The “Node Exporter” software, also provided by the Prometheus project, can be used to monitor the Kubernetes cluster nodes. This reads out all metrics about CPU, memory and I/O and makes these values available for retrieval under /metrics. Prometheus itself later “crawls” these metrics at regular intervals. A DaemonSet controls that one container/pod at a time is started on a Kubernetes node. With the help of the service, all endpoints are combined under one cluster IP.
apiVersion: apps/v1
kind: DaemonSet
metadata:
  name: node-exporter
spec:
  selector:
    matchLabels:
      app: node-exporter
  template:
    metadata:
      labels:
        app: node-exporter
      name: node-exporter
    spec:
      hostNetwork: true
      hostPID: true
      containers:
      - image: quay.io/prometheus/node-exporter:v0.18.1
        name: node-exporter
        ports:
        - containerPort: 9100
          hostPort: 9100
          name: scrape
        resources:
          requests:
            memory: 30Mi
            cpu: 100m
          limits:
            memory: 50Mi
            cpu: 200m
        volumeMounts:
        - name: proc
          readOnly:  true
          mountPath: /host/proc
        - name: sys
          readOnly: true
          mountPath: /host/sys
      volumes:
      - name: proc
        hostPath:
          path: /proc
      - name: sys
        hostPath:
          path: /sys
---
apiVersion: v1
kind: Service
metadata:
  labels:
    app: node-exporter
  annotations:
    prometheus.io/scrape: 'true'
  name: node-exporter
spec:
  ports:
  - name: metrics
    port: 9100
    protocol: TCP
  selector:
    app: node-exporter
kubectl apply -f 02-exporters.yaml
daemonset.apps/node-exporter created
service/node-exporter created
Service Monitor
With the so-called third party resource “ServiceMonitor”, provided by the Prometheus operator, it is possible to include the previously started service, in our case node-exporter, for future monitoring. The TPR itself receives a label team: frontend, which in turn is later used as a selector for the Prometheus instance.
apiVersion: monitoring.coreos.com/v1
kind: ServiceMonitor
metadata:
  name: node-exporter
  labels:
    team: frontend
spec:
  selector:
    matchLabels:
      app: node-exporter
  endpoints:
  - port: metrics
kubectl apply -f 03-service-monitor-node-exporter.yaml
servicemonitor.monitoring.coreos.com/node-exporter created
Prometheus Instance
A Prometheus instance is defined, which now collects all services based on the labels and obtains the metrics from their endpoints.
apiVersion: monitoring.coreos.com/v1
kind: Prometheus
metadata:
  name: prometheus
spec:
  serviceAccountName: prometheus
  serviceMonitorSelector:
    matchLabels:
      team: frontend
  resources:
    requests:
      memory: 400Mi
  enableAdminAPI: false
kubectl apply -f 04-prometheus-service-monitor-selector.yaml
prometheus.monitoring.coreos.com/prometheus created
Prometheus Service
The started Prometheus instance is exposed with a service object. After a short waiting time, a cloud load balancer is started that can be reached from the internet and passes through requests to our Prometheus instance.
apiVersion: v1
kind: Service
metadata:
  name: prometheus
spec:
  type: LoadBalancer
  ports:
  - name: web
    port: 9090
    protocol: TCP
    targetPort: web
  selector:
    prometheus: prometheus
kubectl apply -f 05-prometheus-service.yaml
service/prometheus created


kubectl get services
NAME         TYPE           CLUSTER-IP       EXTERNAL-IP   PORT(S)          AGE
prometheus   LoadBalancer   10.254.146.112    pending      9090:30214/TCP   58s
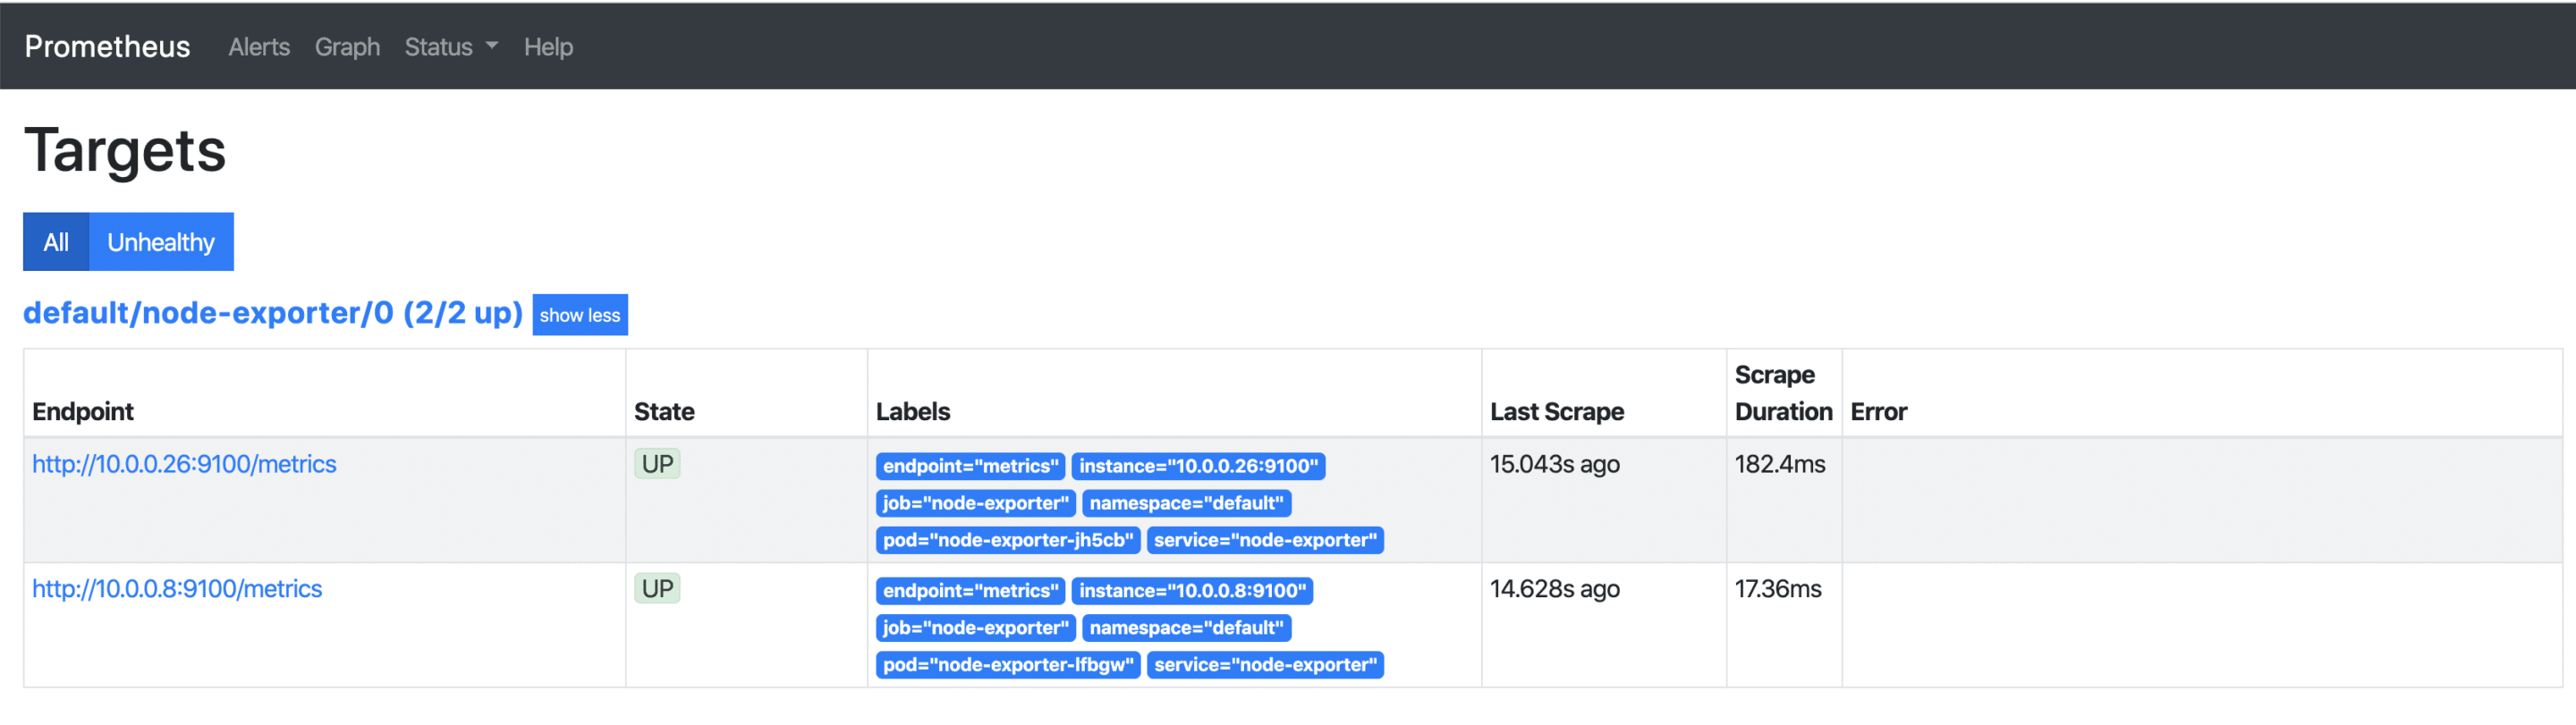
As soon as the external IP address is available, it can be accessed via http://x.x.x.x:9090/targets and you can see all your Kubernetes nodes, whose metrics will be retrieved regularly from now on. If additional nodes are added later, they are automatically included or removed again.
Visualisation with Grafana
The collected metrics can be easily and nicely visualised with Grafana. Grafana is an analysis tool that supports various data backends.
apiVersion: v1
kind: Service
metadata:
  name: grafana
spec:
#  type: LoadBalancer
  ports:
  - port: 3000
    targetPort: 3000
  selector:
    app: grafana
---
apiVersion: apps/v1
kind: Deployment
metadata:
  labels:
    app: grafana
  name: grafana
spec:
  selector:
    matchLabels:
      app: grafana
  replicas: 1
  revisionHistoryLimit: 2
  template:
    metadata:
      labels:
        app: grafana
    spec:
      containers:
      - image: grafana/grafana:latest
        name: grafana
        imagePullPolicy: Always
        ports:
        - containerPort: 3000
        env:
          - name: GF_AUTH_BASIC_ENABLED
            value: "false"
          - name: GF_AUTH_ANONYMOUS_ENABLED
            value: "true"
          - name: GF_AUTH_ANONYMOUS_ORG_ROLE
            value: Admin
          - name: GF_SERVER_ROOT_URL
            value: /api/v1/namespaces/default/services/grafana/proxy/
kubectl apply -f grafana.yaml
service/grafana created
deployment.apps/grafana created


kubectl proxy
Starting to serve on 127.0.0.1:8001
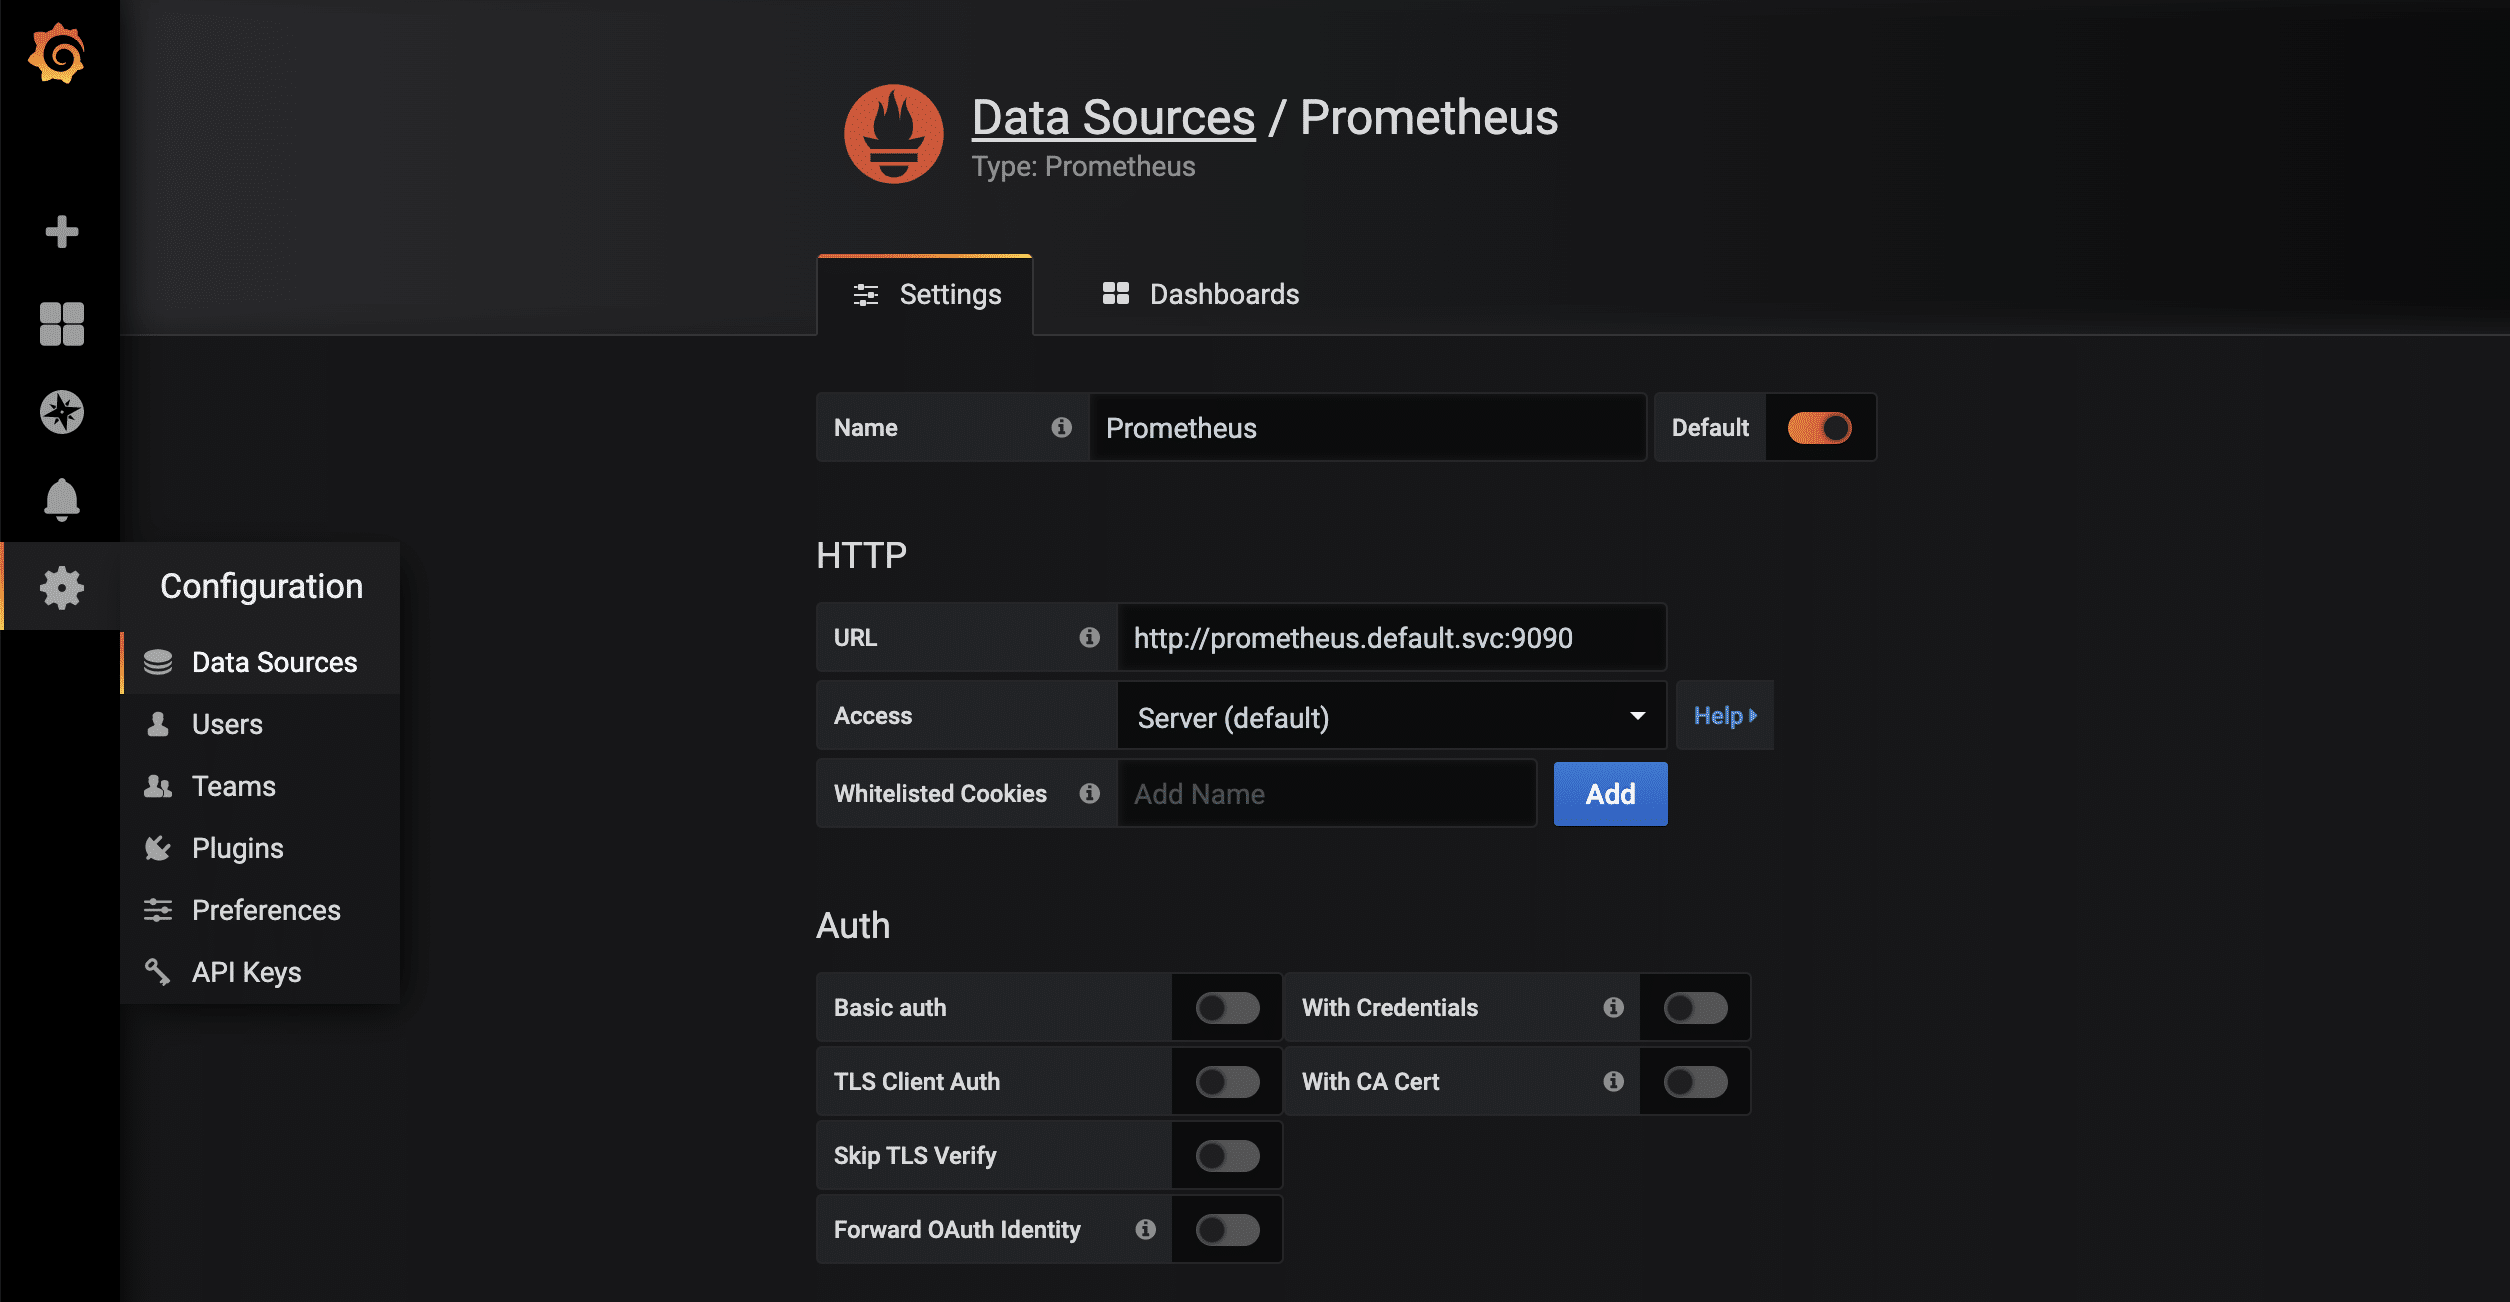
As soon as the proxy connection is available through kubectl, the started Grafana instance can be called up via http://localhost:8001/api/v1/namespaces/default/services/grafana/proxy/ in the browser. Only a few more steps are necessary so that the metrics available in Prometheus can now also be displayed in a visually appealing way. First, a new data source of the type Prometheus is created. Thanks to kubernetes’ own and internal DNS, the URL is http://prometheus.default.svc:9090. The schema is servicename.namespace.svc. Alternatively, of course, the cluster IP can also be used.
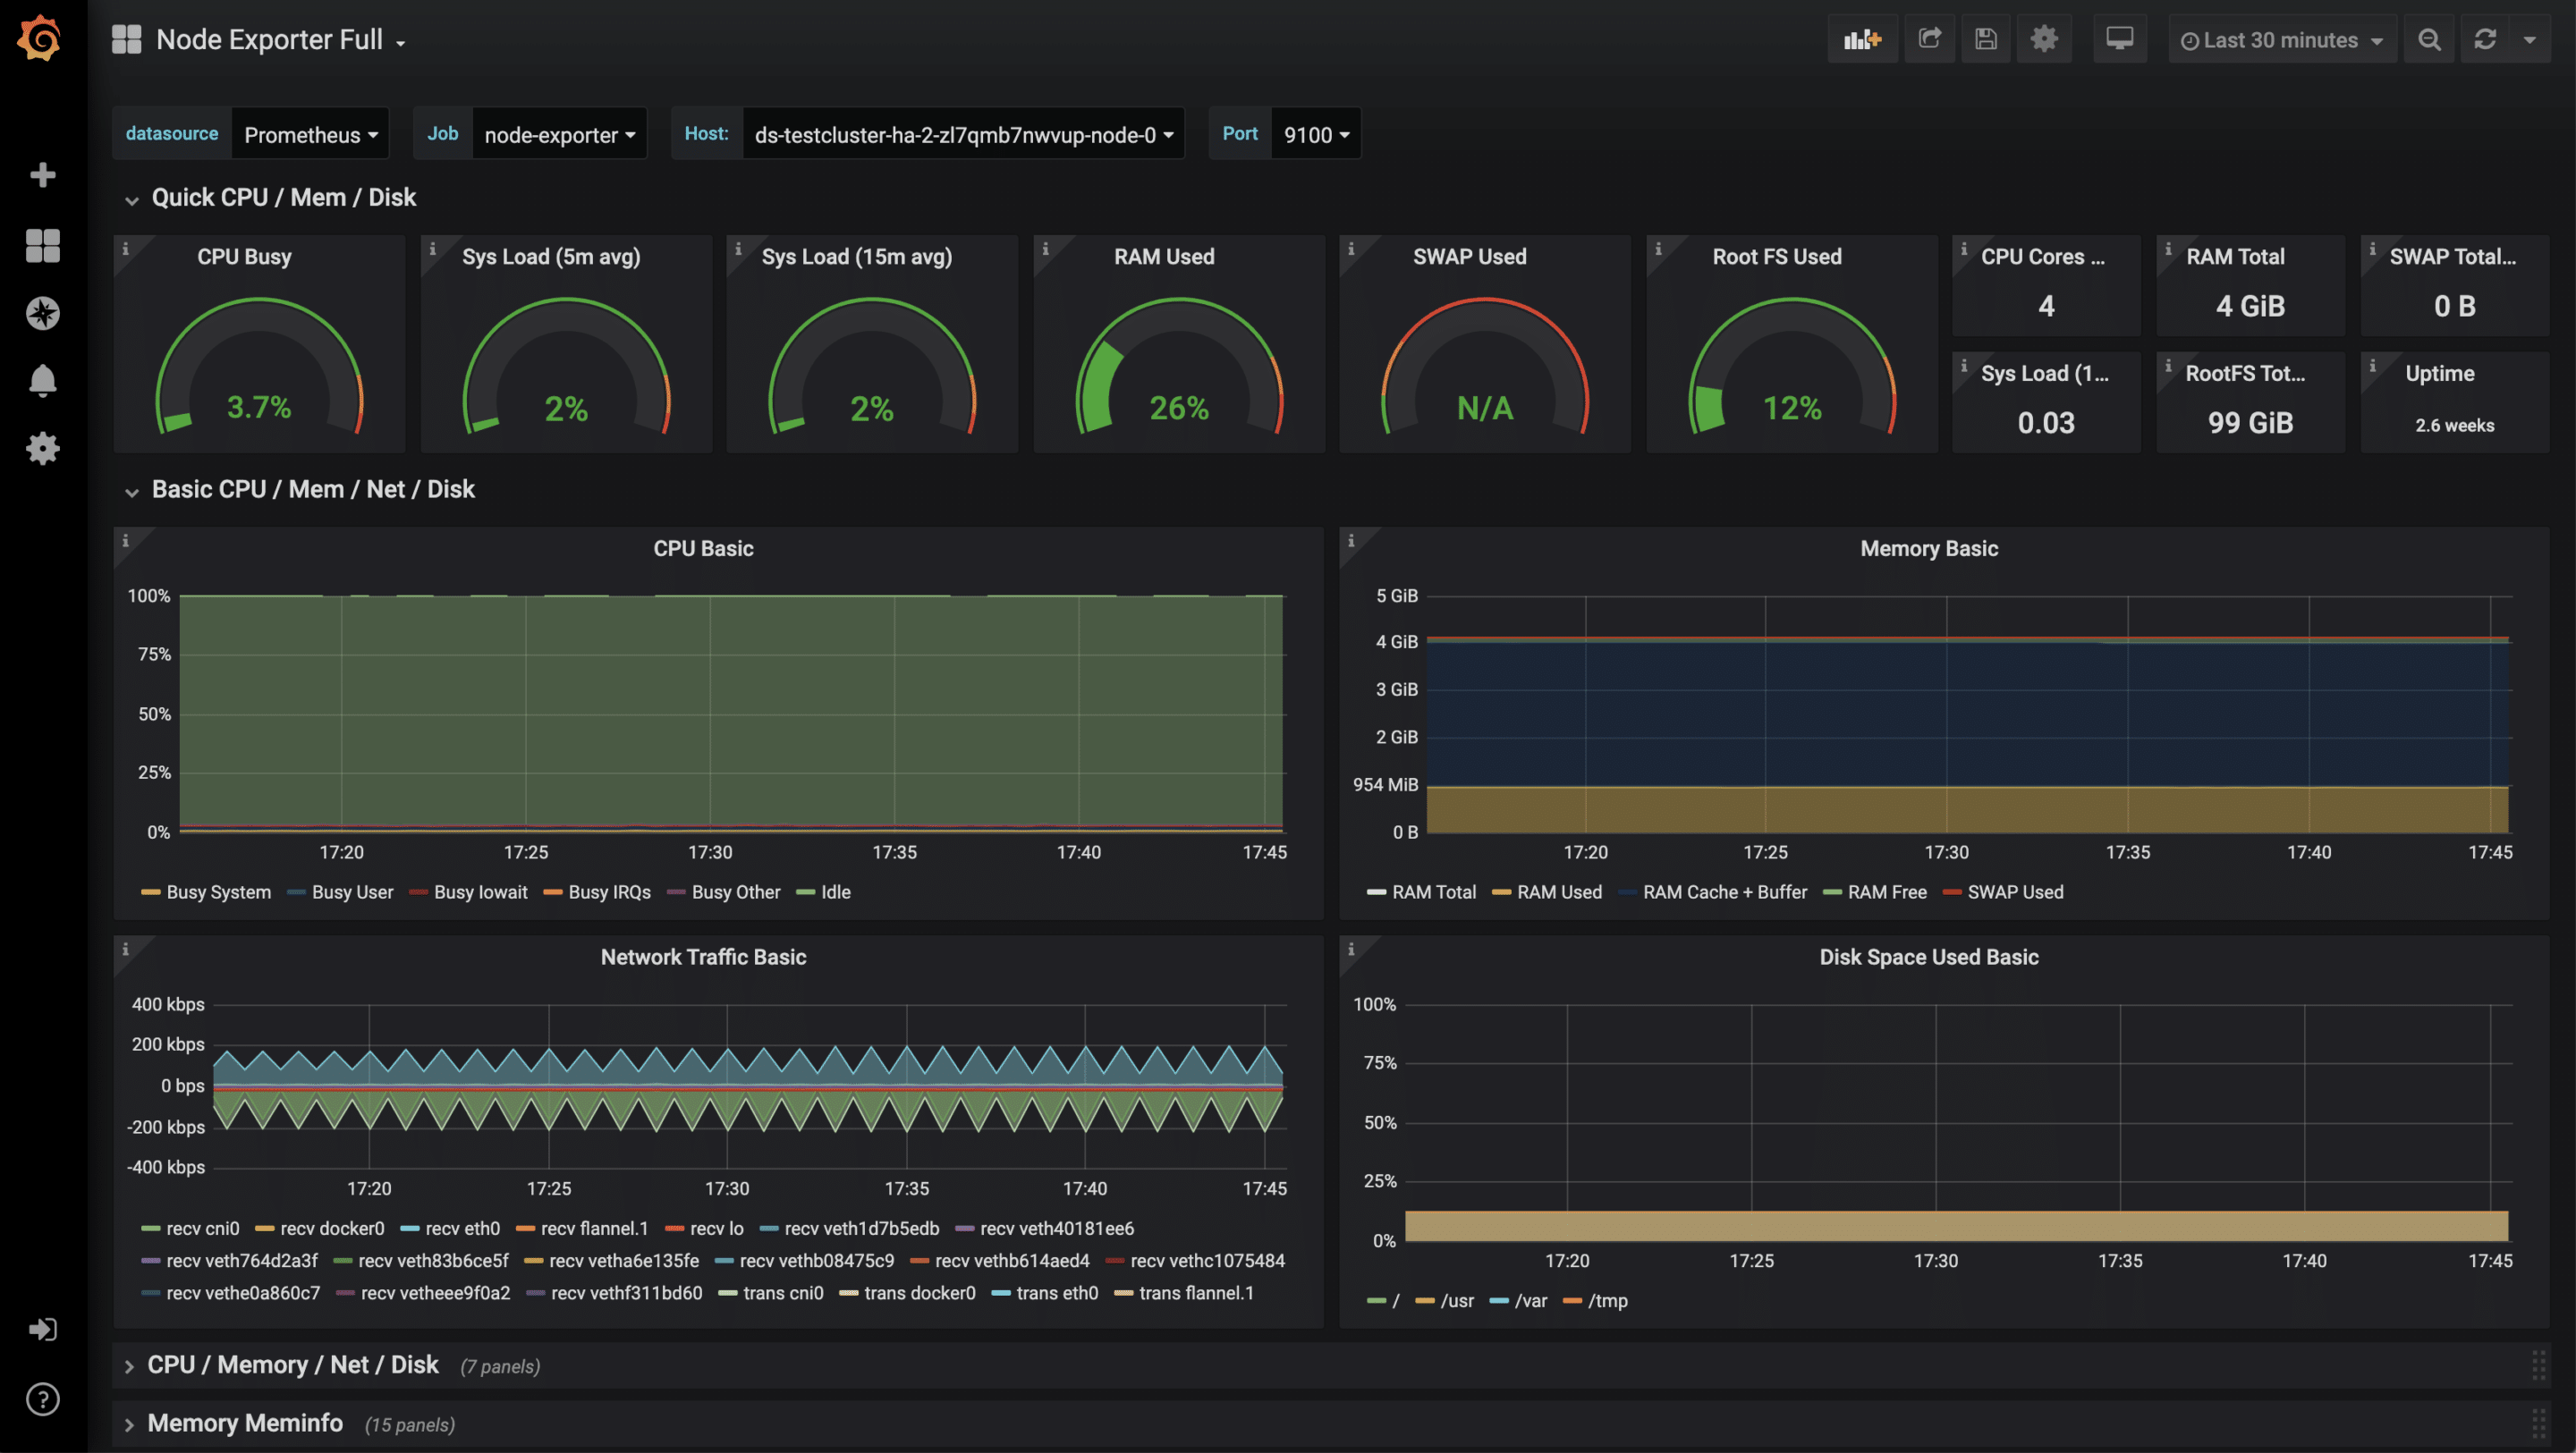
For the collected metrics of the node-exporter, there is already a very complete Grafana dashboard that can be imported via the import function. The ID of the dashboard is 1860.
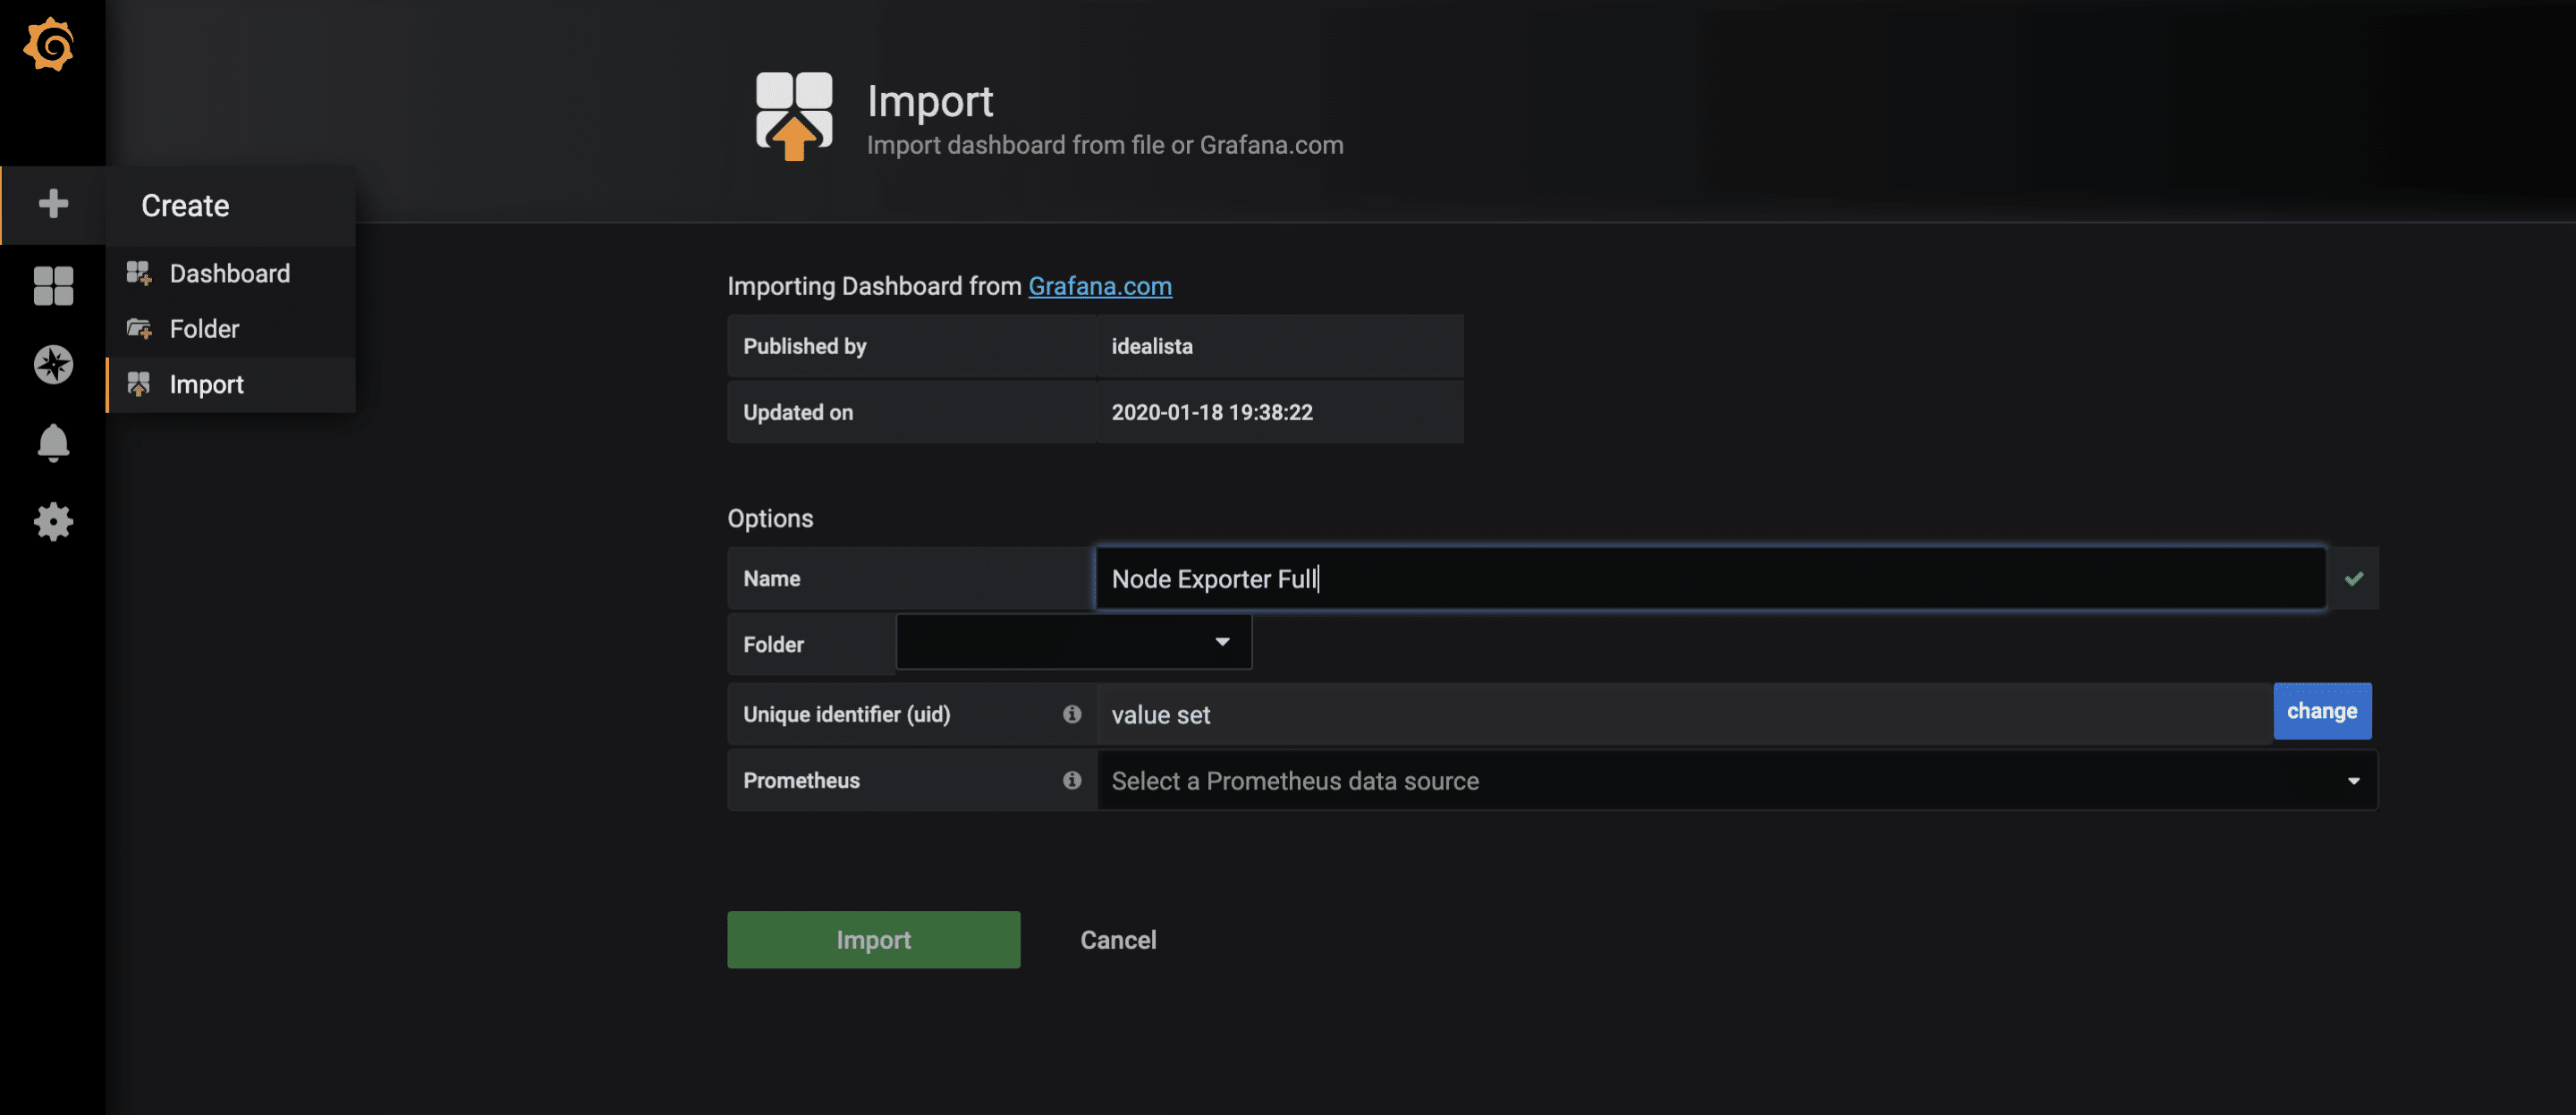
After the successful import of the dashboard, the metrics can now be examined.
Monitoring of further applications
In addition to these rather technical statistics, other metrics of your own applications are also possible, for example HTTP requests, SQL queries, business logic and much more. There are hardly any limits here due to the very flexible data format. To collect your own metrics, there are, as always, several approaches. One of them is to equip your application with a /metrics endpoint. Some frameworks such as Ruby on Rails already have useful extensions. Another approach are so-called sidecars. A sidecar is an additional container that runs alongside the actual application container. Together they form a pod that shares namespace, network, etc. The sidecar then runs code. The sidecar then runs code that checks the application and makes the results available to Prometheus as parseable values. Essentially, both approaches can be linked to the Prometheus operator, as in the example shown above.
by Achim Ledermüller | May 20, 2020 | Kubernetes, Tutorials
With the first steps in Kubernetes, you already know how to launch applications in your Kubernetes cluster. Now we will expose your application online. How the whole thing works and how you can best get started yourself with a Kubernetes Nginx Ingress Controller is explained below with an example.
To make applications accessible from the outside in a Kubernetes cluster, you can use a load balancer type service. In the NETWAYS Cloud, we start an Openstack Octavia LB with a public IP in the background and forward the incoming traffic to the pods (bingo). So, we need a separate load balancer with public IP for each application. In order to be able to work more resource- and cost-efficiently in a case like this, named-based virtual hosts and server name indication (sni) were developed a long time ago. The well-known NGINX web server supports both and, as a Kubernetes ingress controller, it can make all our http/s applications quickly and easily accessible with only one public IP address.
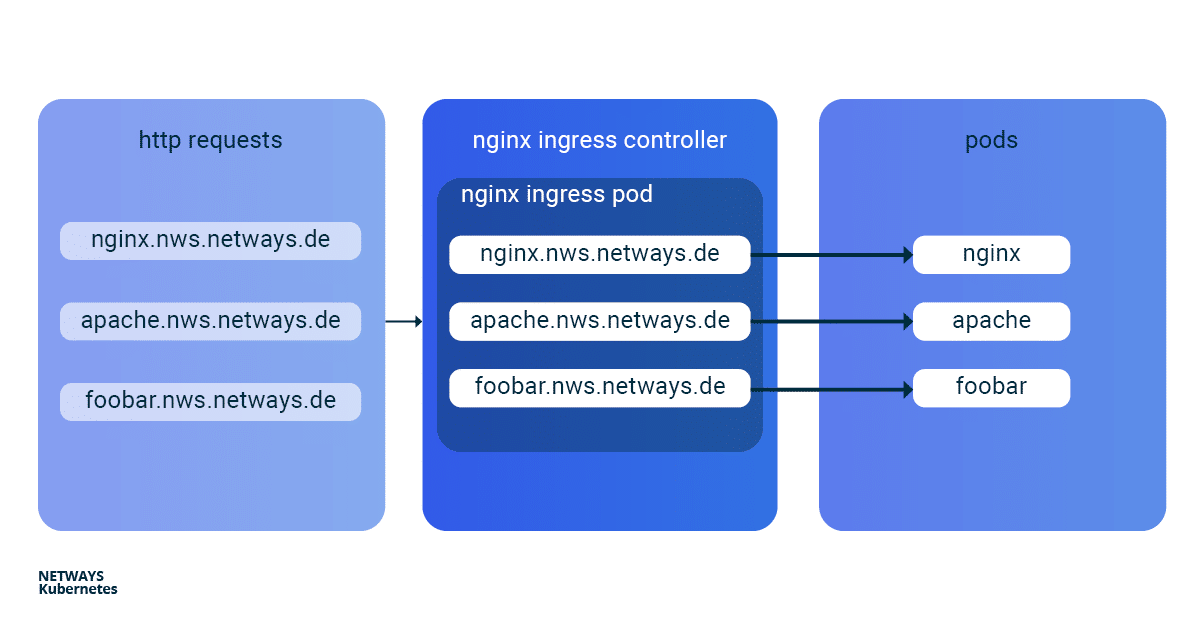
The installation and updating of the Ningx Ingress Controller is very simplified thanks to a helmet chart. With K8s Ingress objects, you configure the mapping of vHosts, URI paths and TLS certificates to K8s services and consequently to our applications. So that the buzzwords don’t prevent you from seeing the essentials, here is a brief overview of how the HTTP requests are forwarded to our applications:
Installation of Kubernetes Nginx Ingress Controller

For easy installation of the Kubernetes Nginx Ingress Controller, you should use Helm. Helm describes itself as a package manager for Kubernetes applications. Besides installation, Helm also offers easy updates of its applications. As with kubectl, you only need the K8s config to get started:
helm install my-ingress stable/nginx-ingress
With this command Helm starts all necessary components in the default namespace and gives them the label my-ingress. A deployment, a replicaset and a pod are created for the Nginx Ingress Controller. All http/s requests must be forwarded to this pod so that it can sort the requests based on vHosts and URI paths. For this purpose a service of the type loadbalancer was created, which listens for a public IP and forwards the incoming traffic on ports 443 and 80 to our pod. A similar construct is also created for the default-backend, which I will not go into here. So that you don’t lose the overview, you can display all the components involved with kubectl:
kubectl get all -l release=my-ingress  #with default-backend
kubectl get all -l release=my-ingress -l component=controller #without default-backend
NAME                                                             READY    STATUS      RESTARTS
pod/my-ingress-nginx-ingress-controller-5b649cbcd8-6hgz6         1/1      Running     0

NAME                                                             READY    UP-TO-DATE  AVAILABLE
deployment.apps/my-ingress-nginx-ingress-controller              1/1      1           1

NAME                                                             DESIRED  CURRENT     READY
replicaset.apps/my-ingress-nginx-ingress-controller-5b649cbcd8   1        1           1

NAME                                              TYPE           CLUSTER-IP       EXTERNAL-IP      PORT(S)
service/my-ingress-nginx-ingress-controller       LoadBalancer   10.254.252.54    185.233.188.56   80:32110/TCP,443:31428/TCP
Example Applications: Apache und Nginx
Next, we start two simple example applications. In this example, I use Apache and Nginx. The goal is to make both applications available under their own name-based virtual hosts: nginx.nws.netways.de und apache.nws.netways.de. In order for the two deployments to be accessible within the K8s cluster, we still need to connect each of them with a service.
K8s Deployments
Nginx Deployment
apiVersion: apps/v1
kind: Deployment
metadata:
  name: nginx-deployment
  labels:
    app: nginx
spec:
  replicas: 3
  selector:
    matchLabels:
      app: nginx
  template:
    metadata:
      labels:
        app: nginx
    spec:
      containers:
      - name: nginx
        image: nginx:1.7.9
        ports:
        - containerPort: 80
Apache Deployment
apiVersion: apps/v1
kind: Deployment
metadata:
  name: apache-deployment
  labels:
    app: apache
spec:
  replicas: 3
  selector:
    matchLabels:
      app: apache
  template:
    metadata:
      labels:
        app: apache
    spec:
      containers:
      - name: apache
        image: httpd:2.4
        ports:
        - containerPort: 80
K8s Service
Nginx Service
apiVersion: v1
kind: Service
metadata:
  name: nginx-svc
spec:
  ports:
  - port: 80
    targetPort: 80
    protocol: TCP
    name: http
  selector:
    app: nginx
Apache Service
apiVersion: v1
kind: Service
metadata:
  name: apache-svc
spec:
  ports:
  - port: 80
    targetPort: 80
    protocol: TCP
    name: http
  selector:
    app: apache
Virtual Hosts without TLS
In order to pass the requests from the Nginx controller to our applications, we need to roll out a suitable Kubernetes Ingress object. In the
spec section of the Ingress object we can define different paths and
virtuell Hosts. In this example we see
vHosts for
nginx.nws.netways.de and
apache.nws.netways.de. For each of the two vHosts, the corresponding
service is of course entered in the
backend area.
The public IP can be found in the service of the Nginx Ingress Controller and kubectl describe shows all important details about the service (see below). For testing, it is best to modify its /etc/hosts file and enter the IP of LoadBalancer Ingress there.
K8s Ingress
apiVersion: networking.k8s.io/v1beta1
kind: Ingress
metadata:
  name: my-ingress
spec:
  rules:
  - host: apache.nws.netways.de
    http:
      paths:
        - backend:
            serviceName: apache-svc
            servicePort: 80
  - host: nginx.nws.netways.de
    http:
      paths:
        - backend:
            serviceName: nginx-svc
            servicePort: 80
kubectl describe service/my-ingress-nginx-ingress-controller
kubectl get service/my-ingress-nginx-ingress-controller -o jsonpath='{.status.loadBalancer.ingress[].ip}’
Virtual Hosts with TLS
Of course, you rarely offer applications publicly accessible without encryption. Especially for TLS certificates, Kubernetes has its own type
tls within the
secret object. All you need is a TLS certificate and the corresponding key. With
kubectl you can store the pair in Kubernetes:
kubectl create secret tls my-secret –key cert.key –cert cert.crt
The created secret can then be referenced by the specified name my-secret in spec of the Ingress object. To do this, enter our virtual host and the corresponding TLS certificate in the hosts array within tls. An automatic redirect from http to https is activated from the beginning.
apiVersion: networking.k8s.io/v1beta1
kind: Ingress
metadata:
  name: my-ingress
spec:
  tls:
    - hosts:
      - apache.nws.netways.de
      - nginx.nws.netways.de
      secretName: my-secret
  rules:
  - host: apache.nws.netways.de
    http:
      paths:
        - backend:
            serviceName: apache-svc
            servicePort: 80
  - host: nginx.nws.netways.de
    http:
      paths:
        - backend:
            serviceName: nginx-svc
            servicePort: 80
Conclusion
With the Nginx Ingress Controller it is easy to make your web-based applications publicly accessible. The features and configuration options offered should cover the requirements of all applications and can be found in the official User Guide. Besides your own application, you only need a Helm Chart and a K8s Ingress object. Kubernetes also manages to hide many complex layers and technologies with only a few abstract objects like deployment and ingress. With a NETWAYS Managed Kubernetes solution, you can take full advantage of this abstraction and focus on your own application. So, get started!
by Achim Ledermüller | May 13, 2020 | Kubernetes, Tutorials
You have a brand new Kubernetes cluster and want to get started now? But regardless of whether you have a local minikube or a Managed Kubernetes with all the bells and whistles, the first Kubernetes objects in the super simple YAML format will make almost everyone frown at first. What are deployments, services and so on? And what are all the labels for? Let’s try to shed some light onto this.
The most important Kubernetes Objects
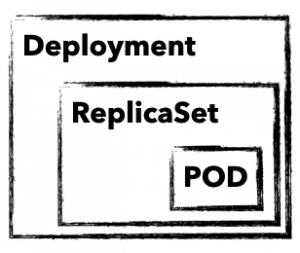
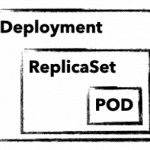 To manage and control a Kubernetes cluster, you need to use Kubernetes-API-Objects, in which you describe the desired state of the cluster. These are sent to the cluster in simple YAML format with the help of kubectl. In addition to an API version, metadata and the object type, there is usually a spec section in which you describe the desired state of your application. spec can be defined differently for each object and is nested in many cases. For example, an object deployment contains attributes for an object replicaSet, which in turn has attributes for a pod object in its own spec section. But before it gets too complicated, here is a brief explanation of these three important objects:
deployment
A deployment describes a desired state of an application and attempts to constantly create it. Deployments can be used to start, scale, update, roll back and delete applications. Deployment objects are usually used to manage applications.
replicaSet
A replicaSet ensures the availability of a defined number of identical pods. If necessary, new pods are started and also stopped. replicaSet is normally only used indirectly through a deployment.
pod
A pod defines a group of containers (often only one) that share a common namespace on a host. The shared namespaces (e.g. shared file system or network) facilitate easy communication between the containers. A pod is always accessible through a unique IP in the cluster. Normally, pods are only used indirectly through a deployment.
With these three objects, we can start our first MariaDB deployment and establish an initial connection with it.
The first K8s-Deployment
As a first simple application, we will start a non-replicated MariaDB as a deployment. But before we take a closer look at the definition, send the object to your cluster with kubectl apply:
But before we take a closer look at the definition, send the object to your cluster with apply:
kubectl apply -f mariadb.yaml deployment.apps/mariadb-deploy created
You don’t have a
kubectl yet? Find out how you install
kubectl (click) and save your
kubeconfig in
~/.kube/config
For changes to your deployment, you can simply adapt the yaml file and send it to your cluster with the same command. If you want to delete your deployment simply replace the apply with a delete.
mariadb.yaml
apiVersion: apps/v1
kind: Deployment
metadata:
  name: mariadb-deploy
  labels:
    app: mariadb
spec:
  replicas: 1
  selector:
    matchLabels:
      app: mariadb
  template:
    metadata:
      labels:
        app: mariadb
    spec:
      containers:
        - name: mariadb
          image: mariadb
          ports:
            - containerPort: 3306
              name: db-port
          env:
            - name: MYSQL_ROOT_PASSWORD
              value: "123456"
Explanation:
Taking a closer look, we find parameters for all three Kubernetes objects in the example.
Lines 1-6: We define API version, kind, name and a freely selectable label for our deployment object.
Lines 8-11: Are part of the replicaset (RS). Here we define matchLabels as well as the number of replicas and include pods with the label mariadb in the RS.
Lines 13-25: Define your pod. In addition to a label, parameters for the MariaDB container are passed. We use the official MariaDB image, define port 3306 and set the root password for the database via an environment variable.
A better overview with describe and get
With describe and get you can get a quick overview and all the necessary details of your applications. A simple kubectl describe deployment/mariadb-deploy provides all details about the MariaDB deployment from the example.
get all on the other hand, lists all objects, but the output can quickly become confusing even with just a few applications in the cluster. That’s why there are different ways to filter the output, e.g. using the label app. With the following examples, however, you will quickly have the output under control.
Example for get with different filters
kubectl get pods
kubectl get deployment
kubectl get replicaset -l app=mariadb -o json
kubectl get po –field-selector=status.phase=Running
The quickest way to display the components of your MariaDB is to use the label filter:
kubectl get all -l app=mariadb
NAME READY STATUS RESTARTS AGE
pod/mariadb-deploy-64bfc599f7-j9twt 1/1 Running 0 64s

NAME READY UP-TO-DATE AVAILABLE AGE
deployment.apps/mariadb-deploy 1/1 1 1 64s

NAME DESIRED CURRENT READY AGE
replicaset.apps/mariadb-deploy-64bfc599f7 1 1 1 64s
Now that you know how to check the current and desired state of your application, let’s take a closer look at pods and containers.
Integrate with pods
Without further configuration, applications are only accessible within the Kubernetes cluster. In addition, you rarely want to make a database accessible via a public IP. kubectl therefore offers two options with proxy and port-forward to guarantee access to internal pods and services. For MariaDB we use port-forward and send all traffic that arrives locally on port 3306 through kubectl to our MariaDB pod. By the way, you can use the name of the deployment directly. The names of pod and replicaSet lead to the same result. The quickest way to check whether the connection is working is to use telnet or a MySQL client:
kubectl port-forward deployment.apps/mariadb-deploy 3306:3306

mysql -h 127.0.0.1 -P 3306 -u root -p123456

telnet 127.0.0.1 3306
kubectl offers further possibilities for interacting with its container with log and exec. The former, of course, shows you the stdout of your pod. exec , on the other hand, is probably mostly used to start an interactive shell. Similar to docker, you need the parameters interactive and tty (-ti), to get a functional bash:
kubectl exec -it mariadb-deploy-64bfc599f7-j9twt — /bin/bash
With these few commands you can reach and debug your pods shielded in the K8s cluster. Applications that are only accessible within the cluster do not always make sense, of course. In order for others to access them, you need a Kubernetes service with a public IP. But there is much more behind a service.
Connect your pods with a service
A service binds a fixed internal IP address (ClusterIP) to a set of pods, which are identified by labels. Compared to a service pods pods are very short-lived. In this example, as soon as we trigger an upgrade of MariaDB, our deployment discards the existing pod and starts a new one. Since each pod has its own IP address, the IP address at which your MariaDB is accessible also changes. Thanks to the labels, the service finds the new pod and the traffic is forwarded correctly.
A service therefore ensures the internal accessibility of your deployments through the ClusterIP. In addition, a service can also have the type Loadbalancer. This binds a public IP and forwards all traffic to the ClusterIP. In the following example, you can see a service for your MariaDB.
In addition to API version, kind and metadata, there is again the spec section. Protocol, port and targetPort define, which traffic is forwarded. In the selector, the labels are used to determine which pods are to be served. With the optional line type: LoadBalancer a public IP is bound in addition to an internal cluster IP.
apiVersion: v1
kind: Service
metadata:
  name: mariadb-service
spec:
  ports:
  - port: 3306
    targetPort: 3306
    protocol: TCP
    name: mariadb
  selector:
    app: mariadb
  type: LoadBalancer
In this example, exactly one container is defined for a pod and our selector in the server also only applies to one pod. But what happens when replicas are increased in the deployment? First, of course, several pods are started and thus also several MariaDB containers. The selector in the MariaDB service naturally finds them by means of the label and the connections are forwarded to the pods in a round-robin process. Technically, this works without problems in the example, but as long as MariaDB itself is not installed as a replicating cluster, this makes little sense.
What comes next?
With the examples shown here, you can roll out and debug your first applications. But you can already guess that we’ve only scratched the surface on Kubernetes and of course there are still many questions! What happens to my data in MariaDB and how can I connect the short-lived pods to a persistent volume? Do I need a separate public IP for each application? How do I get metrics and logs of my cluster and my applications? We will of course answer these and other questions in the following blogposts. Well then, see you next week!
by Achim Ledermüller | May 6, 2020 | Kubernetes, Tutorials
Interested in how to start a Managed Kubernetes at NWS? Here you can find out how to get started! First, you will need an account for our NETWAYS Web Services platform. After registering, you can start our open source-Apps like RocketChat and GitLab and also create accounts for Openstack and Kubernetes.
tl;dr – Watch a demo
Christian shows you our Managed Kubernetes in a recorded Webinar. Pictures say more than a thousand words?
Of course, you decide on a Kubernetes account and after a few clicks you get to the overview for managing and starting your Kubernetes cluster.
Start your Kubernetes Cluster
The most difficult thing when starting your cluster is probably choosing a name. Unfortunately, we can’t help you with that. How about foobar? But before virtual machines start in the background, you have to decide on a control plane and the number of your worker nodes.
Control Plane
A control plane is all the services and resources needed to manage and control your Kubernetes cluster. These services can be started on one or three master nodes (VM’s). The latter has the advantage that in the event of a failure or an update, the Kubernetes services and API are still available. In addition, depending on the size of the planned cluster, a flavour must be selected for these master nodes. Please note that you can no longer change the number of master nodes and the flavour later.
Worker Nodes
Your applications are started on the worker nodes, which are managed and operated by the control plane. For a highly available application, you need at least two of them. As with the master nodes, you must select a flavour. Due to the resource-based billing, the costs for 16GB Ram, for example, are always the same, regardless of whether they are distributed over two or four VMs. You can adjust the number of worker nodes to your current needs at any time in the NWS web interface.
Starting the cluster can take five to 15 minutes, depending on the number of master and worker nodes. So there is enough time for a coffee. In the background, VM’s, floating IP’s, load balancers, security groups and much more are started, configured and checked piece by piece until your Kubernetes is ready for use. What now?
Get an overview of the NWS web interface
After your cluster has been started, the NWS web interface gives you a good first overview. There you will find important information and other options for controlling your cluster:
Status and Worker Nodes
You can check the status of your master and worker nodes as well as the accessibility of the API at any time in the NWS web interface. If you need more resources, you can adjust the number of your worker nodes with a few clicks and also perform a hard restart of individual VM’s in the event of a problem.
Kubernetes Dashboard
For an easier start, we have already rolled out and prepared the Kubernetes Dashboard for you. A simple insight can be achieved in three small steps.
Object Store
When you start the cluster, you also get access to our object store. This is based on Ceph and is compatible with the S3 and Swift API. Your data is replicated via our ISO-27001 certified data centres and remains in Germany.
Cluster Update
To make Kubernetes cluster updates as easy as possible for you, we test them thoroughly. But to keep you in control, you decide at the push of a button when the updates are applied. In addition to the Kubernetes services, the operating system of the VM’s is also updated. In the case of a highly available Control Plane, the components are updated piece by piece so that there is no loss of service. The applications are also moved on your worker nodes so that individual VM’s can be gradually updated and restarted.
kubeconfig
The kubeconfig is a file that contains all the information needed to access the Kubernetes API via the kubectl command. Technically, this YAML file contains the HTTP endpoint of the API, a user name and a TLS client certificate with CA. In the web interface, you can of course download the file and save it immediately under $HOME/.kube/config. This way you can explore your cluster with kubectl without any further parameters. The best way to find out how to install this for your operating system is to consult the official documentation.
Start with kubectl on the command line
Unfortunately, you won’t need our web interface very often when working with Kubernetes on a daily basis. You will spend most of your time on the command line. kubectl is the central tool to control your applications in the cluster. First, you should run a few simple commands to get familiar with your cluster:
kubectl get nodes
Shows you a list of your nodes with status and version.
kubectl describe node <name>
Besides labels, pods and metrics you get a lot of detailed information about your nodes.
kubectl explain <resource type>
With explain you can quickly get more information about individual resource types.
kubectl get all
Shows you an overview of all running resources in the default namespace. With –all-namespaces you can see not only your applications, but also the resources of the Kubernetes cluster itself.
With the kubeconfig and kubectl, you now have everything you need to get started. With what? With part 3 of our series and your first steps in Kubernetes. There you will learn more about deployments, pods and services and how to roll out your first application.
Recent Comments