

Your deployment runs smoothly, everything in the dashboard is green, and yet the first users are already reporting slow load times. Welcome to the day-to-day reality of modern cloud environments. Whereas in the past a single server was either up or down, today you distribute your application across containers, microservices, and Kubernetes clusters. Cloud monitoring in the traditional sense may answer the question “Is it running?”, but it doesn’t answer the much more important question: “Why is it behaving this way right now?”. This is exactly where observability comes into play. In this article, we’ll clarify the difference, show you where traditional monitoring reaches its limits, and explain which open-source stack will really help you make progress in the cloud.
Monitoring and observability are not the same thing
In short: Monitoring tells you whether your system is working. Observability tells you why it’s behaving the way it is. One answers questions you already know. The other helps you with problems you hadn’t even considered.
Traditional monitoring uses predefined metrics and thresholds. You specify that CPU utilization above 90 percent triggers a warning or that a service is no longer accessible. This works great for known error scenarios. The problem: In distributed systems, errors occur that you couldn’t have anticipated when setting up the checks.
Observability, therefore, takes it a step further. The term doesn’t refer to a single piece of software, but rather to a property of your system—namely, how well you can understand its internal state from the outside. A highly observable system provides you with enough data to answer even new, unexpected questions without having to deploy new code first.
What is monitoring?
Monitoring refers to the continuous tracking of defined metrics within an IT infrastructure.
The goal is to identify known issues early on and automatically trigger alerts.
Typical key performance indicators monitored include:
- CPU usage
- RAM
- Hard Drive Capacity
- Network traffic
- Response times
- Number of Requests
- Error Rates
- Availability
- Container Status
- Kubernetes Nodes
Monitoring primarily answers questions such as:
- Is my system running?
- Are all services available?
- Is the CPU overloaded?
- Are there sufficient resources available?
- Are there any unusual load spikes?
Monitoring is ideal for known error patterns and day-to-day operations.
What is observability?
Observability takes it a crucial step further.
Instead of simply monitoring known metrics, observability provides the information needed to analyze unknown causes of errors.
The term originally comes from control engineering and describes the ability to fully understand the internal state of a system based on its outputs.
In the IT field, this means:
“How well can I understand why my system is behaving this way right now?”
Observability is particularly helpful in the following areas:
- complex microservice architectures
- Kubernetes clusters
- hybrid cloud architectures
- Multi-cloud environments
- dynamically scaling applications
Metrics, Logs, and Traces
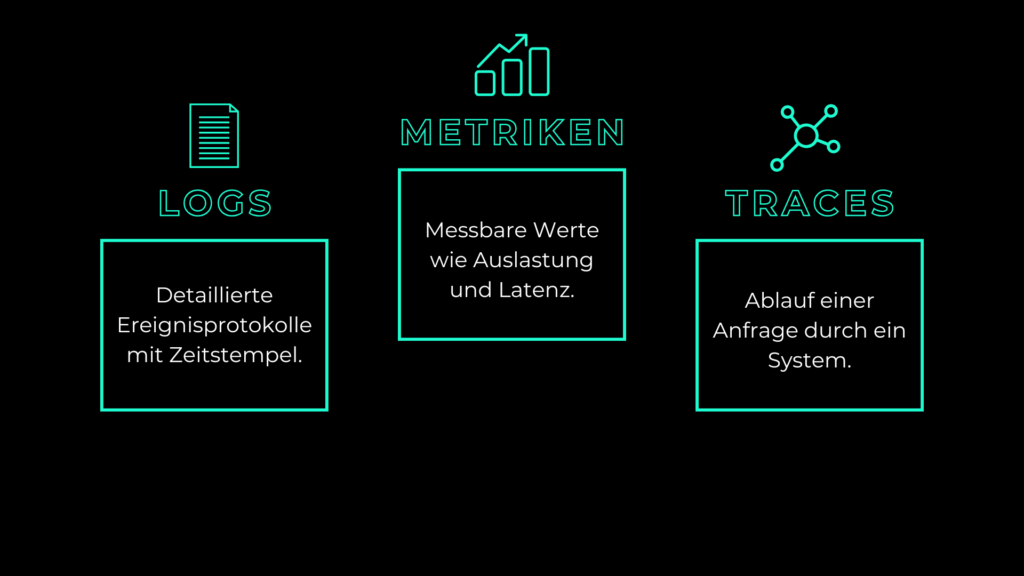
Observability is traditionally based on three types of data that complement each other.
Metrics are numerical measurements over time, such as response times, requests per second, or memory usage. They are compact, inexpensive to store, and ideal for tracking trends and triggering alerts. This is the world where Prometheus thrives.
Examples:
- CPU usage
- RAM Usage
- Request Rate
- Error rate
- Response times
- Database Latency
They are ideal for dashboards, trend analysis, and alerts.
Logs are events recorded over time. They provide context for a specific operation and answer the question of exactly what happened when an error occurred.
Examples:
- Error messages
- User Logins
- API calls
- Database error
- Kubernetes Events
Logs help you track individual events in detail.
Traces show you the path a request takes through your distributed system. If a request passes through five microservices in sequence, a trace reveals where time is being lost. Especially in microservice architectures, this is often the fastest way to identify the actual bottleneck.
For example, a trace documents:
Browser
↓
Load Balancer
↓
API Gateway
↓
Microservice A
↓
Microservice B
↓
Database
↓
Storage
This makes it possible to determine exactly which service is causing the delay.
Distributed tracing is virtually indispensable today, especially in Kubernetes environments.
Monitoring vs. Observability
| Monitoring | Observability |
| monitors known issues | analyzes unknown problems |
| uses defined key performance indicators | combines metrics, logs, and traces |
| detects failures | explains Usachen |
| responds to alarms | enables in-depth error analysis |
| ideal for infrastructure | ideal for complex applications |
Why Traditional Monitoring Reaches Its Limits in the Cloud
The traditional approach dates back to a time when servers had names and ran for years. You knew exactly which machine was hosting which service, and you monitored them individually. In modern cloud environments, the reality is different.
Containers start up and shut down within seconds. Kubernetes moves pods between nodes, IP addresses change constantly, and AutoScaling increases or decreases the number of your instances depending on the load. In an environment like this, a check that verifies whether this specific server is reachable hardly makes any sense. What you want to know isn’t “Is Host X running?”, but “Is my service getting enough resources, and is it responding fast enough?”
Add to that the sheer volume of data. The more dynamic components you have, the more metrics are generated. Without a tool that automatically collects metrics based on labels rather than fixed hostnames, you’ll quickly lose track of everything. That’s exactly why the focus is shifting from individual machines to the behavior of your services as a whole.
The Right Stack: Prometheus, Grafana, and Icinga
The good news: You don’t need an expensive, specialized solution for any of this. A proven open-source stack covers both traditional monitoring and modern observability, and the two approaches complement each other well.
Prometheus and Grafana: Collecting and Visualizing Metrics
Prometheus is the de facto standard for metrics-based monitoring in cloud-native environments. Instead of waiting for systems to report their data, Prometheus actively retrieves the metrics through a process known as scraping and stores them in a time-series database. Using the PromQL query language, you can flexibly analyze this data and define alerting rules based on the actual behavior of your services. Because Prometheus works with labels, it handles dynamic Kubernetes environments with ease.
Grafana is the visual counterpart. It transforms raw metrics into meaningful dashboards that even colleagues without PromQL knowledge can understand. Together, Prometheus and Grafana form the backbone of many observability setups. If you’d rather not handle operations yourself, NWS offers both as a managed service—always kept up to date and with a dedicated point of contact.
Icinga: Proven Monitoring with 24/7 Alerting
Not everything can be reduced to metrics. For traditional availability monitoring—such as that of infrastructure, network components, or external endpoints—Icinga is the reliable choice. This open-source tool monitors status using defined checks and immediately triggers an alert if something fails. Its alerting system is sophisticated and flexible, ensuring that the right message reaches the right person at the right time.
In practice, Icinga often demonstrates its strengths through integration. Prometheus provides you with an in-depth, metrics-based view of your applications, while Icinga handles the reliable basic monitoring and 24/7 alerting for your infrastructure. Icinga also offers NWS as a managed service upon request, including maintenance and updates.
Best Practices for Observability in Cloud Environments
Tools alone don’t make your system observable. What matters is how you use them. A few principles have proven effective:
Issue alerts based on symptoms, not on every possible cause. You should receive an alert only when users actually notice something—such as rising error rates or response times. Reporting every single technical anomaly leads to alert fatigue, and eventually, important alerts will go unnoticed.
Define clear SLOs. Service Level Objectives provide you with measurable targets, such as “99.9 percent of requests are answered in under 300 milliseconds.” You can use these to tailor your alerting system and discuss quality objectively rather than relying on gut feelings.
Build dashboards that answer questions. A good dashboard isn’t a graveyard of data; instead, it helps you quickly pinpoint the source of the problem when an emergency arises. Fewer panels with clear information are better than an overloaded dashboard.
You don’t have to do everything yourself. Observability is powerful, but managing it in-house requires time and expertise, especially when it comes to updates and scaling. If your team would rather focus on your own application, a managed service is a real relief. That’s exactly why NWS also offers MyEngineer®, a personalized support service that helps you with implementation.
Typical use cases
Identifying Performance Issues
An application suddenly starts running slowly.
Monitoring shows:
- CPU Normal
- Normal RAM
- Normal network
Observability shows:
- Database Latency Is Increasing
- Service B is waiting for API C
- API C responds slowly
- Cause identified within a few minutes
Error Analysis in Microservices
Logins occasionally fail.
Monitoring only detects increased error rates.
Observability, on the other hand, shows:
- which request was affected
- which service triggered the error
- Which database query failed?
- Which API caused the timeout?
Capacity Planning
Long-term metrics can help identify trends:
- Memory Growth
- CPU usage
- Network Development
- Database size
This allows resources to be expanded in a timely manner.
Safety monitoring
Observability also supports security teams.
Examples:
- Unusual login attempts
- Unusual network activity
- suspicious API calls
- Unusual container-related activities
- Anomalies in User Behavior
Challenges During Implementation
Implementing observability offers companies tangible benefits, but it also comes with typical challenges. Small and medium-sized businesses, in particular, should be aware of these obstacles so they can address them early on.
• Data volume: Observability generates an enormous amount of logs, metrics, and traces. Without clear filtering and aggregation strategies, teams can quickly lose track of the big picture and unnecessarily strain resources.
• Complexity: Modern IT environments consist of microservices, hybrid clouds, and dynamic deployments. A well-thought-out architecture is necessary to integrate observability effectively, rather than simply adding individual tools on an ad hoc basis.
• Tool silos: In many companies, departments use different platforms. This leads to redundant data, loss of context, and conflicting analyses. A centralized solution is essential for breaking down these silos.
• Processes and Culture: Technology alone isn’t enough. Teams need coordinated rules for alerts, escalations, and reviews. Without shared standards, observability remains fragmented and loses its effectiveness.
These challenges can be overcome—provided that observability is viewed as a strategic priority rather than a secondary technical project.
Conclusion
Observability isn’t a product you install once and then check off your list—it’s an approach. Traditional cloud monitoring reliably answers the question of whether something is running as expected. Observability addresses the much more important question of “why” and makes your distributed system transparent, even when unexpected problems arise. With Prometheus and Grafana for metrics and Icinga for reliable basic monitoring, you have a mature open-source stack that seamlessly combines traditional monitoring with modern observability. Ultimately, what matters isn’t the volume of data, but having the right answers at the right moment.
What does your monitoring setup look like right now? Do you have everything under control, or are you drowning in dashboards and alerts? If you’d rather have Prometheus, Grafana, or Icinga run for you instead of dealing with maintenance and scaling, check out our Managed Services. We’ll set up the right solution for you, leaving you free to focus on your core business.

0 Comments