Managed Prometheus-
-Monitoring from Germany

Your cloud native monitoring and alerting system

Prices

All prices are subject to statutory value added tax
Are you looking for an individual, customized solution from Managed Prometheus?

Features

wdt_ID wdt_last_edited_at Feature Basic Advanced Premium
14 Storage Space 50 150 300
15 SMS 100 500 1000
16 Grafana
17 Predefined Kubernetes Dashboards
18 One-Click NWS K8s Integration
Show more

Managed Prometheus Setup

Updates. Operation. We take care of it!

Managed Prometheus is a fully managed monitoring service based on open source. It allows you to collect, store, and analyze metrics from your applications, systems, and infrastructure. Grafana is also included, so you can visualize your data right away.
We take care of:
  • Setup
  • Configuration
  • Backups
  • Monitoring
  • Updates

Your advantages

Test free of charge Icon

Test free of charge

Test 30 days free of charge – without restrictions.
Grafana included

Grafana included

Meaningful analyses from day one, without having to set anything up yourself.
Automatic Alerts

Automatic Alerts

Prometheus proactively alerts you via text message in the event of a disruption.
Icons Support

Support service

Personal, flexible and directly accessible.
Managed & easy to maintain

One-Click Integration

For NWS Kubernetes clusters, you can set up monitoring with a single click—and it’s just as easy for Docker, VMs, and cloud services.

Enterprise-level infrastructure

Every GitLab instance at NWS runs on the same robust foundation

3-fold replicated

3-fold replicated

Your data is replicated three times for maximum reliability.
Icon data centers in Germany

Hosted in Germany

Your data is securely hosted in our data centers in Germany.
Security and data protection icon

Security and data protection

We are ISO 27001-certified and GDPR-compliant.
Kubernetes platform

Modern Kubernetes platform

Operated on our certified Kubernetes infrastructure.

Your advantage

Even in the event of a hardware failure, your data remains available at all times: no data loss, no downtime.

Your advantage

Full GDPR compliance without effort. Ideal for industries with high data protection requirements.

Your advantage

You can score points with customers and partners with certified security without having to audit yourself.

Your advantage

Kubernetes can use self-healing to quickly restart a “broken” instance and thus ensure greater availability.

Managed Prometheus Interface

Keep an eye on your infrastructure’s utilization, performance, and status
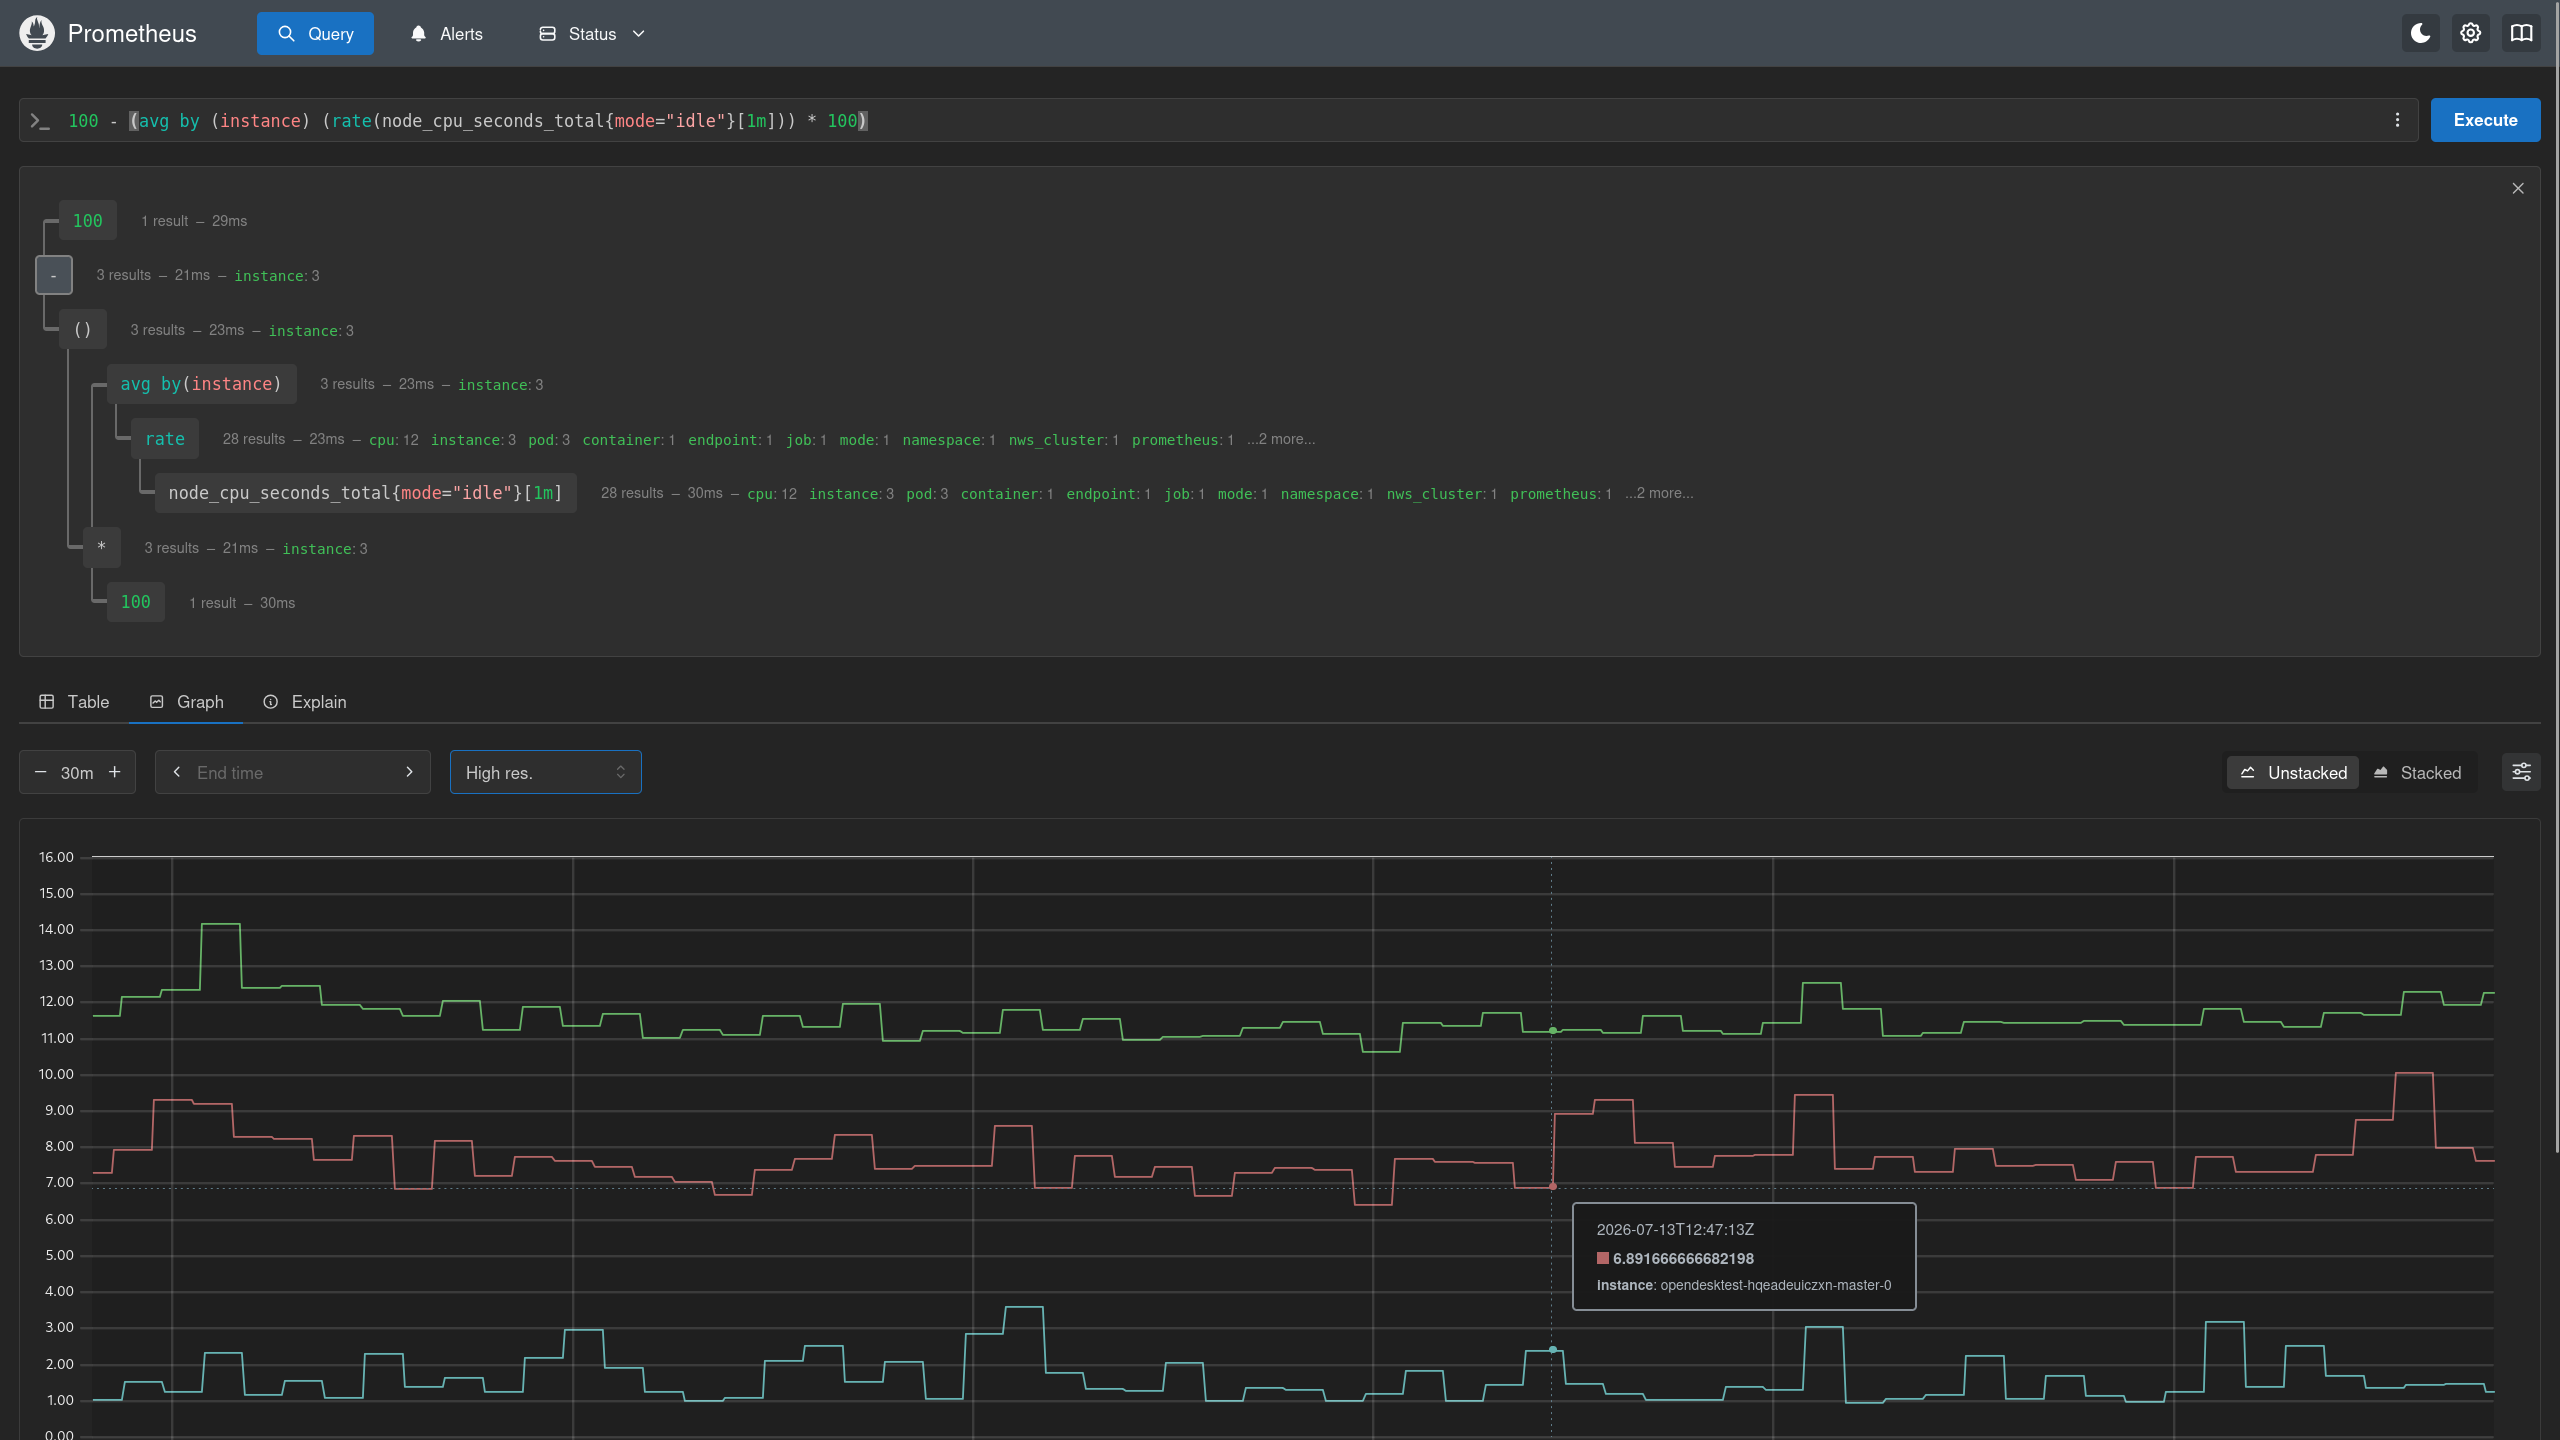
Insights into Maanged Prometheus. Here are the features you have.
l

Write precise queries in PromQL and run them with a single click.

Break down complex expressions in the query tree and see how each intermediate result is calculated.

Use labels such as “instance,” “pod,” or “namespace” to immediately identify the source of the metrics.

t

Switch between Table, Graph, and Explain, depending on how you need your data.

Adjust the time period and resolution to examine peak loads in greater detail.

Visualize metrics such as memory usage over customizable time periods.

b

Read exact values, including timestamps, directly from the interactive tooltip.

p

Toggle individual data sets on or off with a single click to focus on what’s important.

Typical use cases

Infrastructure and system monitoring

Keep a constant eye on servers, services, and entire infrastructures. Prometheus reliably collects and stores your metrics, while we handle operations, scaling, and high availability. This allows you to identify bottlenecks and anomalies before they become problems.

Performance metrics in cloud and container environments

Monitor utilization and performance where modern applications actually run—in the cloud and in containers. Prometheus integrates seamlessly with Kubernetes, Docker, virtual machines, and cloud services.

Proactive monitoring with automated alerting

Don’t wait for users to report an outage to you. Prometheus proactively monitors your systems and automatically alerts you in the event of an issue. This allows you to respond quickly, even when you’re not looking at the dashboard.

Basis for SRE and DevOps teams to optimize operations

Build the data foundation on which SRE and DevOps teams base their work. With reliable metrics, Grafana visualizations, and alerts, you can identify trends, plan capacity, and continuously improve your operations.

Our customers

Our solutions are in use – and with measurable success. Take a look at how other companies benefit from our services.

Awards

NWS Certificate ISO IEC 27001
NWS Certificate OpenInfra Foundation Silver Member
NWS Certificate Kubernetes Certified Service Provider
NWS Certificate CNCF Silver Member
Readers' Choice Service Provider Award 2025 - Kubernetes

FAQ

2
3

Is Grafana included?

Yes, Grafana is included in all packages, along with preconfigured Kubernetes dashboards. This lets you visualize your metrics from day one without having to build your own dashboards first.
2
3

Are there additional costs for metrics or traffic?

No. The package prices are fixed; there are no additional fees for metrics or traffic. This gives you full control over your costs and ensures there are no surprises on your bill.
2
3

How many metrics can I save?

Each package includes a fixed amount of storage space. Within that storage space, you decide whether you want to keep more metrics for a shorter period or fewer metrics for a longer period. This allows you to flexibly tailor your monitoring to your needs.
2
3

How do I integrate Prometheus into my environment?

Prometheus integrates seamlessly with Kubernetes, Docker, virtual machines, and cloud services. For our NWS Kubernetes clusters, there’s even a one-click integration that lets you enable monitoring in just a few seconds.
2
3

How does the alerting system work?

Prometheus proactively monitors your systems and automatically alerts you in the event of an issue. Each package includes a fixed quota for SMS notifications, ranging from 100 to 1,000 SMS messages depending on the plan. This way, you’ll be notified of problems early on, even if you’re not currently looking at your dashboard.
2
3

What advantages does Managed Prometheus offer over a self-hosted solution?

The biggest advantage is that you have absolutely no operational overhead: We take care of scaling, upgrades, high availability, and security updates. On top of that, you get fast integration with Kubernetes, Docker, VMs, and cloud services; a transparent pricing structure with no hidden infrastructure costs; and highly available operations with automatic backups and alerts. So you get professional monitoring without having to run your own monitoring infrastructure.

No operational overhead: We handle scaling, upgrades, high availability, and security updates.
Quick Integration: Seamless integration with Kubernetes, Docker, VMs, and cloud services.
Cost Control: A transparent pricing structure with no hidden infrastructure costs.
Reliability: Highly available operation with automatic backups and alerts.

2
3

Who can I contact if I have problems?

Just contact us by email at nws@netways.de or through our contact form. We'll assist you directly and personally.

2
3

Can I cancel at any time?

Yes. Managed Prometheus can be canceled on a monthly basis, so you're not locked into a long-term contract. You can easily cancel it in your contract overview.
2
3

What is the target audience for Prometheus?

Managed Prometheus is designed for anyone who wants to reliably monitor their applications, systems, and infrastructure without having to operate a monitoring environment themselves. SRE and DevOps teams, as well as operators of cloud and container environments—such as those using Kubernetes or Docker—benefit particularly from this service. But even smaller teams without prior monitoring experience can get started quickly and easily thanks to preconfigured Grafana dashboards.