

In addition to our own NWS AI for research, brainstorming, and other day-to-day tasks, I’ve recently become a big fan of Gemini CLI. This open-source tool brings Google’s Gemini AI to my terminal so I can ask questions about my projects and environments without switching context every other minute.
In addition, the Gemini CLI provides built-in tools to interact with my environment, as well as support for MCP (Model Context Protocol) servers to integrate and interact with other services.
It also comes with OpenTelemetry support. At first glance, this may seem a little strange – why do you need observability for a local CLI? On second thought, however, the whole feature makes more sense.
For example, Gemini CLI can be used in CI/CD pipelines, e.g. to perform code reviews or generate summaries of new features, bug fixes, etc. In such scenarios, it is very useful to know how many tokens have been used in a pipeline, how many (and which) tools have been called, etc.
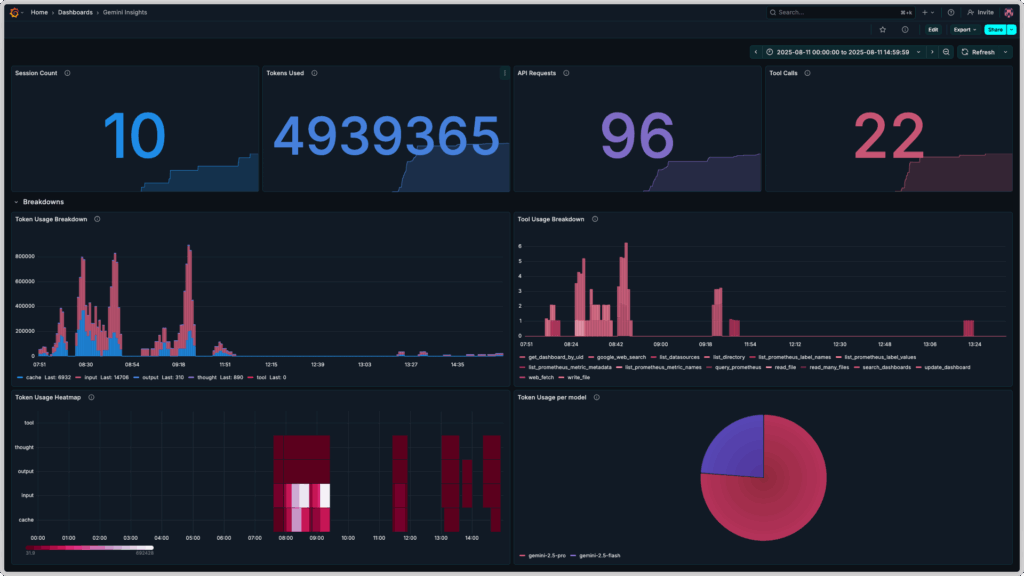
Thus, this blog post is about Gemini CLI observability with the OpenTelemetry Collector, Prometheus and Grafana. The end result looks something like this:
Preparation
To bring our vision of Gemini CLI observability to life, we need to install a few tools on our local systems:
- Gemini CLI
- Docker or another container runtime that understands Docker’s
composeformat
After installing Gemini CLI, we first have to authenticate ourselves. This can be done in one of three ways, all of which are described in the README of the project on GitHub:
- via OAuth with a Google Account (for individuals with or without Gemini quota)
- via Gemini API key (for individuals with paid access to Gemini AI)
- via Vertex API key (for teams and organizations)
After successful authentication, we can start the Gemini CLI – if not done already – with the command gemini and chat directly with Gemini AI, from our terminals.
Configuration and deployment
To configure and deploy our Gemini CLI observability project, we next need to create a few configuration files and a compose.yml file, which is used by Docker to create the compose stack.
To do this, we create a new directory, e.g. gemini-telemetry, in which we will store these files.
We can then start configuring Prometheus.
Configuration of Prometheus
We don’t need to provide a configuration file for Prometheus – we exclusively use it as a storage for metrics that are collected and forwarded by the OpenTelemetry Collector. So, we only have to define a prometheus service in a new file compose.yml – the first part of our Gemini CLI observability stack!
services:
  prometheus:
    image: prom/prometheus:latest
    container_name: prometheus
    command:
      - '--config.file=/etc/prometheus/prometheus.yml'
      - '--storage.tsdb.path=/prometheus'
      - '--web.enable-otlp-receiver'
    ports:
      - "9090:9090"
    volumes:
      - prometheus_data:/prometheus
    restart: unless-stopped

volumes:
prometheus_data: {}Worth mentioning here are the fields command and volumes:
We map a Docker volume called prometheus-data into the Prometheus container to persist our collected metrics from the Gemini CLI, and configure Prometheus so that sending metrics in OpenTelemetry’s OTLP format to Prometheus will work later on.
Next, we are going to configure the OpenTelemetry Collector!
Configuration of the OpenTelemetry Collector
The OpenTelemetry Collector is responsible for processing the metrics sent by the Gemini CLI. A valid collector configuration always consists of at least one receiver, one exporter and one or more pipelines.
Our configuration otel-collector-config.yml looks like this:
receivers:
  otlp:
    protocols:
      grpc:
        endpoint: 0.0.0.0:4317

exporters:
  otlphttp:
    endpoint: "http://prometheus:9090/api/v1/otlp"

service:
  pipelines:
    metrics:
      receivers: [otlp]
exporters: [otlphttp]We also add the otel-collector service to our compose.yml file:
services:
  prometheus:
    image: prom/prometheus:latest
    container_name: prometheus
    command:
      - '--config.file=/etc/prometheus/prometheus.yml'
      - '--storage.tsdb.path=/prometheus'
      - '--web.enable-otlp-receiver'
    ports:
      - "9090:9090"
    volumes:
      - prometheus_data:/prometheus
    restart: unless-stopped

  otel-collector:
    image: otel/opentelemetry-collector-contrib:latest
    container_name: otel-collector
    ports:
      - "4317:4317" # OTLP gRPC
    volumes:
      - ./otel-collector-config.yml:/etc/otel/config.yml
    command:
      - '--config=/etc/otel/config.yml'
    restart: unless-stopped

volumes:
prometheus_data: {}Configuration of Grafana
In Grafana we will configure two things for our Gemini CLI Dashboard:
- a data source for Prometheus
- a dashboard for displaying the collected metrics of the Gemini CLI
Thanks to its provisioning feature, Grafana enables us to configure these in advance. To do so, we first create the required folder structure in our working directory:
mkdir -p grafana/dashboards grafana/provisioning/{datasources,dashboards}Then we create the required files, one datasource each for dashboards and Prometheus, as well as the dashboard definition itself.
Copy the following content into the file grafana/provisioning/datasources/prometheus-datasource.yml:
apiVersion: 1

datasources:
  - name: Prometheus
    type: prometheus
    access: proxy
    url: http://prometheus:9090
isDefault: trueCopy the following content into the file grafana/provisioning/dashboards/dashboard-provider.yml:
apiVersion: 1

providers:
  - name: 'default'
    orgId: 1
    folder: ''
    type: file
    disableDeletion: false
    editable: true
    options:
path: /var/lib/grafana/dashboardsCopy the following dashboard definition into the file grafana/dashboards/gemini-insights.json:
{
"__inputs": [
{
"name": "Prometheus",
"label": "prometheus",
"description": "",
"type": "datasource",
"pluginId": "prometheus",
"pluginName": "Prometheus"
}
],
"__elements": {},
"__requires": [
{
"type": "panel",
"id": "barchart",
"name": "Bar chart",
"version": ""
},
{
"type": "grafana",
"id": "grafana",
"name": "Grafana",
"version": "12.2.0-16890666601"
},
{
"type": "panel",
"id": "heatmap",
"name": "Heatmap",
"version": ""
},
{
"type": "panel",
"id": "piechart",
"name": "Pie chart",
"version": ""
},
{
"type": "datasource",
"id": "prometheus",
"name": "Prometheus",
"version": "1.0.0"
},
{
"type": "panel",
"id": "stat",
"name": "Stat",
"version": ""
}
],
"annotations": {
"list": [
{
"builtIn": 1,
"datasource": {
"type": "grafana",
"uid": "-- Grafana --"
},
"enable": true,
"hide": true,
"iconColor": "rgba(0, 211, 255, 1)",
"name": "Annotations & Alerts",
"type": "dashboard"
}
]
},
"description": "Insights on Gemini CLI usage",
"editable": true,
"fiscalYearStartMonth": 0,
"graphTooltip": 0,
"id": null,
"links": [],
"panels": [
{
"collapsed": false,
"gridPos": {
"h": 1,
"w": 24,
"x": 0,
"y": 0
},
"id": 5,
"panels": [],
"title": "Key Insights",
"type": "row"
},
{
"datasource": {
"type": "prometheus",
"uid": "Prometheus"
},
"description": "Number of sessions during the configured time frame.",
"fieldConfig": {
"defaults": {
"color": {
"mode": "thresholds"
},
"mappings": [],
"thresholds": {
"mode": "absolute",
"steps": [
{
"color": "#2297ea",
"value": 0
}
]
}
},
"overrides": []
},
"gridPos": {
"h": 8,
"w": 6,
"x": 0,
"y": 1
},
"id": 1,
"options": {
"colorMode": "value",
"graphMode": "area",
"justifyMode": "auto",
"orientation": "auto",
"percentChangeColorMode": "standard",
"reduceOptions": {
"calcs": [
"lastNotNull"
],
"fields": "",
"values": false
},
"showPercentChange": false,
"textMode": "auto",
"wideLayout": true
},
"pluginVersion": "12.2.0-16890666601",
"targets": [
{
"datasource": {
"type": "prometheus",
"uid": "Prometheus"
},
"editorMode": "code",
"expr": "count(present_over_time(gemini_cli_session_count_total[$__range]))",
"legendFormat": "__auto",
"range": true,
"refId": "A"
}
],
"title": "Session Count",
"type": "stat"
},
{
"datasource": {
"type": "prometheus",
"uid": "Prometheus"
},
"description": "Number of tokens used during the configured time frame.",
"fieldConfig": {
"defaults": {
"color": {
"mode": "thresholds"
},
"mappings": [],
"thresholds": {
"mode": "absolute",
"steps": [
{
"color": "#518ce1",
"value": 0
}
]
}
},
"overrides": []
},
"gridPos": {
"h": 8,
"w": 6,
"x": 6,
"y": 1
},
"id": 2,
"options": {
"colorMode": "value",
"graphMode": "area",
"justifyMode": "auto",
"orientation": "auto",
"percentChangeColorMode": "standard",
"reduceOptions": {
"calcs": [
"lastNotNull"
],
"fields": "",
"values": false
},
"showPercentChange": false,
"textMode": "auto",
"wideLayout": true
},
"pluginVersion": "12.2.0-16890666601",
"targets": [
{
"editorMode": "code",
"expr": " sum(increase(gemini_cli_token_usage_total[$__range]))",
"legendFormat": "__auto",
"range": true,
"refId": "A",
"datasource": {
"type": "prometheus",
"uid": "Prometheus"
}
}
],
"title": "Tokens Used",
"type": "stat"
},
{
"datasource": {
"type": "prometheus",
"uid": "Prometheus"
},
"description": "Number of API requests done during the configured time frame.",
"fieldConfig": {
"defaults": {
"color": {
"mode": "thresholds"
},
"decimals": 0,
"mappings": [],
"thresholds": {
"mode": "absolute",
"steps": [
{
"color": "#8b78ce",
"value": 0
}
]
},
"unit": "none"
},
"overrides": []
},
"gridPos": {
"h": 8,
"w": 6,
"x": 12,
"y": 1
},
"id": 3,
"options": {
"colorMode": "value",
"graphMode": "area",
"justifyMode": "auto",
"orientation": "auto",
"percentChangeColorMode": "standard",
"reduceOptions": {
"calcs": [
"lastNotNull"
],
"fields": "",
"values": false
},
"showPercentChange": false,
"textMode": "auto",
"wideLayout": true
},
"pluginVersion": "12.2.0-16890666601",
"targets": [
{
"editorMode": "code",
"expr": "sum(increase(gemini_cli_api_request_count_total[$__range]))",
"legendFormat": "__auto",
"range": true,
"refId": "A",
"datasource": {
"type": "prometheus",
"uid": "Prometheus"
}
}
],
"title": "API Requests",
"type": "stat"
},
{
"datasource": {
"type": "prometheus",
"uid": "Prometheus"
},
"description": "Number of tool calls during the configured time frame.",
"fieldConfig": {
"defaults": {
"color": {
"mode": "thresholds"
},
"decimals": 0,
"mappings": [],
"thresholds": {
"mode": "absolute",
"steps": [
{
"color": "#cf6180",
"value": 0
}
]
},
"unit": "none"
},
"overrides": []
},
"gridPos": {
"h": 8,
"w": 6,
"x": 18,
"y": 1
},
"id": 4,
"options": {
"colorMode": "value",
"graphMode": "area",
"justifyMode": "auto",
"orientation": "auto",
"percentChangeColorMode": "standard",
"reduceOptions": {
"calcs": [
"lastNotNull"
],
"fields": "",
"values": false
},
"showPercentChange": false,
"textMode": "auto",
"wideLayout": true
},
"pluginVersion": "12.2.0-16890666601",
"targets": [
{
"editorMode": "code",
"expr": "sum(increase(gemini_cli_tool_call_count_total[$__range]))",
"legendFormat": "__auto",
"range": true,
"refId": "A",
"datasource": {
"type": "prometheus",
"uid": "Prometheus"
}
}
],
"title": "Tool Calls",
"type": "stat"
},
{
"collapsed": false,
"gridPos": {
"h": 1,
"w": 24,
"x": 0,
"y": 9
},
"id": 8,
"panels": [],
"title": "Breakdowns",
"type": "row"
},
{
"datasource": {
"type": "prometheus",
"uid": "Prometheus"
},
"description": "Breakdown of token usage during the configured time frame. Slight inaccuracies due to extrapolation possible.",
"fieldConfig": {
"defaults": {
"color": {
"mode": "palette-classic"
},
"custom": {
"axisBorderShow": false,
"axisCenteredZero": false,
"axisColorMode": "text",
"axisLabel": "",
"axisPlacement": "auto",
"fillOpacity": 80,
"gradientMode": "none",
"hideFrom": {
"legend": false,
"tooltip": false,
"viz": false
},
"lineWidth": 1,
"scaleDistribution": {
"type": "linear"
},
"thresholdsStyle": {
"mode": "off"
}
},
"fieldMinMax": false,
"mappings": [],
"thresholds": {
"mode": "absolute",
"steps": [
{
"color": "green",
"value": 0
}
]
}
},
"overrides": [
{
"matcher": {
"id": "byName",
"options": "cache"
},
"properties": [
{
"id": "color",
"value": {
"fixedColor": "#2297ea",
"mode": "fixed"
}
}
]
},
{
"matcher": {
"id": "byName",
"options": "input"
},
"properties": [
{
"id": "color",
"value": {
"fixedColor": "#cf6180",
"mode": "fixed"
}
}
]
},
{
"matcher": {
"id": "byName",
"options": "output"
},
"properties": [
{
"id": "color",
"value": {
"fixedColor": "#518ce1",
"mode": "fixed"
}
}
]
},
{
"matcher": {
"id": "byName",
"options": "thought"
},
"properties": [
{
"id": "color",
"value": {
"fixedColor": "#8b78ce",
"mode": "fixed"
}
}
]
}
]
},
"gridPos": {
"h": 11,
"w": 12,
"x": 0,
"y": 10
},
"id": 6,
"options": {
"barRadius": 0,
"barWidth": 0.97,
"fullHighlight": false,
"groupWidth": 0.7,
"legend": {
"calcs": [
"last"
],
"displayMode": "list",
"placement": "bottom",
"showLegend": true
},
"orientation": "auto",
"showValue": "never",
"stacking": "normal",
"tooltip": {
"hideZeros": false,
"mode": "single",
"sort": "none"
},
"xTickLabelRotation": 0,
"xTickLabelSpacing": 100
},
"pluginVersion": "12.2.0-16890666601",
"targets": [
{
"editorMode": "code",
"expr": "sum by(type)(increase(gemini_cli_token_usage_total[$__rate_interval]))",
"legendFormat": "__auto",
"range": true,
"refId": "A",
"datasource": {
"type": "prometheus",
"uid": "Prometheus"
}
}
],
"title": "Token Usage Breakdown",
"type": "barchart"
},
{
"datasource": {
"type": "prometheus",
"uid": "Prometheus"
},
"description": "Breakdown of tool usage during the configured time frame. Slight inaccuracies due to extrapolation possible.",
"fieldConfig": {
"defaults": {
"color": {
"fixedColor": "#cf6180",
"mode": "shades"
},
"custom": {
"axisBorderShow": false,
"axisCenteredZero": false,
"axisColorMode": "text",
"axisLabel": "",
"axisPlacement": "auto",
"fillOpacity": 80,
"gradientMode": "none",
"hideFrom": {
"legend": false,
"tooltip": false,
"viz": false
},
"lineWidth": 1,
"scaleDistribution": {
"type": "linear"
},
"thresholdsStyle": {
"mode": "off"
}
},
"fieldMinMax": false,
"mappings": [],
"thresholds": {
"mode": "absolute",
"steps": [
{
"color": "green",
"value": 0
}
]
}
},
"overrides": []
},
"gridPos": {
"h": 11,
"w": 12,
"x": 12,
"y": 10
},
"id": 7,
"options": {
"barRadius": 0,
"barWidth": 0.97,
"fullHighlight": false,
"groupWidth": 0.7,
"legend": {
"calcs": [],
"displayMode": "list",
"placement": "bottom",
"showLegend": true
},
"orientation": "auto",
"showValue": "never",
"stacking": "normal",
"tooltip": {
"hideZeros": false,
"mode": "single",
"sort": "none"
},
"xTickLabelRotation": 0,
"xTickLabelSpacing": 100
},
"pluginVersion": "12.2.0-16890666601",
"targets": [
{
"editorMode": "code",
"expr": "sum by (function_name)(increase(gemini_cli_tool_call_count_total[$__rate_interval]))",
"legendFormat": "__auto",
"range": true,
"refId": "A",
"datasource": {
"type": "prometheus",
"uid": "Prometheus"
}
}
],
"title": "Tool Usage Breakdown",
"type": "barchart"
},
{
"datasource": {
"type": "prometheus",
"uid": "Prometheus"
},
"description": "Displays token usage by token type as a headmap",
"fieldConfig": {
"defaults": {
"custom": {
"hideFrom": {
"legend": false,
"tooltip": false,
"viz": false
},
"scaleDistribution": {
"type": "linear"
}
}
},
"overrides": []
},
"gridPos": {
"h": 11,
"w": 12,
"x": 0,
"y": 21
},
"id": 9,
"interval": "5m",
"options": {
"calculate": false,
"cellGap": 1,
"color": {
"exponent": 0.5,
"fill": "dark-orange",
"mode": "scheme",
"reverse": false,
"scale": "exponential",
"scheme": "PuRd",
"steps": 16
},
"exemplars": {
"color": "rgba(255,0,255,0.7)"
},
"filterValues": {
"le": 1e-9
},
"legend": {
"show": true
},
"rowsFrame": {
"layout": "auto"
},
"tooltip": {
"mode": "single",
"showColorScale": false,
"yHistogram": false
},
"yAxis": {
"axisPlacement": "left",
"reverse": false,
"unit": "dateTimeAsLocal"
}
},
"pluginVersion": "12.2.0-16890666601",
"targets": [
{
"editorMode": "code",
"expr": "sum by (type) (increase(gemini_cli_token_usage_total[$__rate_interval]))",
"legendFormat": "__auto",
"range": true,
"refId": "A",
"datasource": {
"type": "prometheus",
"uid": "Prometheus"
}
}
],
"title": "Token Usage Heatmap",
"type": "heatmap"
},
{
"datasource": {
"type": "prometheus",
"uid": "Prometheus"
},
"description": "Breakdown of token usage per model during the configured time frame. Slight inaccuracies due to extrapolation possible.",
"fieldConfig": {
"defaults": {
"color": {
"mode": "palette-classic"
},
"custom": {
"hideFrom": {
"legend": false,
"tooltip": false,
"viz": false
}
},
"mappings": []
},
"overrides": [
{
"matcher": {
"id": "byName",
"options": "gemini-2.5-flash"
},
"properties": [
{
"id": "color",
"value": {
"fixedColor": "#8b78ce",
"mode": "fixed"
}
}
]
},
{
"matcher": {
"id": "byName",
"options": "gemini-2.5-pro"
},
"properties": [
{
"id": "color",
"value": {
"fixedColor": "#cf6180",
"mode": "fixed"
}
}
]
}
]
},
"gridPos": {
"h": 11,
"w": 12,
"x": 12,
"y": 21
},
"id": 10,
"options": {
"legend": {
"displayMode": "list",
"placement": "bottom",
"showLegend": true
},
"pieType": "pie",
"reduceOptions": {
"calcs": [
"lastNotNull"
],
"fields": "",
"values": false
},
"tooltip": {
"hideZeros": false,
"mode": "single",
"sort": "none"
}
},
"pluginVersion": "12.2.0-16890666601",
"targets": [
{
"editorMode": "code",
"expr": "sum by (model) (increase(gemini_cli_token_usage_total[$__range]))",
"legendFormat": "__auto",
"range": true,
"refId": "A",
"datasource": {
"type": "prometheus",
"uid": "Prometheus"
}
}
],
"title": "Token Usage per model",
"type": "piechart"
}
],
"schemaVersion": 41,
"tags": [],
"templating": {
"list": []
},
"time": {
"from": "now-3h",
"to": "now"
},
"timepicker": {},
"timezone": "browser",
"title": "Gemini Insights",
"uid": "mam5ksd",
"version": 10,
"weekStart": ""
}
Once we have created the three required files, we can add a third service called grafana to our compose.yml:
services:
  prometheus:
    image: prom/prometheus:latest
    container_name: prometheus
    command:
      - '--config.file=/etc/prometheus/prometheus.yml'
      - '--storage.tsdb.path=/prometheus'
      - '--web.enable-otlp-receiver'
    ports:
      - "9090:9090"
    volumes:
      - prometheus_data:/prometheus
    restart: unless-stopped

  otel-collector:
    image: otel/opentelemetry-collector-contrib:latest
    container_name: otel-collector
    ports:
      - "4317:4317" # OTLP gRPC
    volumes:
      - ./otel-collector-config.yml:/etc/otel/config.yml
    command:
      - '--config=/etc/otel/config.yml'
    restart: unless-stopped

  grafana:
    image: grafana/grafana:latest
    container_name: grafana
    ports:
      - "3000:3000"
    volumes:
      - ./grafana/provisioning/datasources:/etc/grafana/provisioning/datasources
      - ./grafana/provisioning/dashboards:/etc/grafana/provisioning/dashboards
      - ./grafana/dashboards:/var/lib/grafana/dashboards
    restart: unless-stopped
    depends_on:
      - prometheus

volumes:
prometheus_data: {}Deployment of the Gemini CLI Observability Stack
Our compose.yml is now ready and we can start the stack with Docker:
docker compose up -dWe can then test whether the applications are available – Prometheus should be available at http://localhost:9090, Grafana at http://localhost:3000 (the credentials are admin for user name and password).
In Grafana, we should already see the Gemini Insights dashboard under Dashboards. However, all the dashboard panels currently show No Data – Gemini CLI is not yet configured to export OpenTelemetry metrics. This is the last step on our journey to Gemini CLI observability.
Configuration of Gemini CLI
Gemini CLI can be configured via files in various locations on our system:
- User-specific configuration at
$HOME/.gemini/settings.json - Project-specific configuration at
./.gemini/settings.json - System-wide configuration, e.g. at
/etc/gemini-cli/settings.jsonon Linux systems
Entries further down in the list overwrite entries further up. More detailed information can be found in the project’s configuration documentation on GitHub.
In our case, it would make sense for Gemini CLI to export OpenTelemetry metrics for each session in our user context. We therefore create (or edit) the file $HOME/.gemini/settings.json and add the following section:
"telemetry": {
  "enabled": true,
  "target": "local",
  "otlpEndpoint": "http://localhost:4317",
  "logPrompts": true
}We can then start a new session in the Gemini CLI and have a chat with Gemini AI – for example, to get a summary of our working directory for this blog post. After 1-2 minutes, data should end up in Prometheus and thus also appear in our dashboard in Grafana.
In Prometheus, we can test this by entering gemini_cli in the Prometheus UI query field. A list of all Gemini CLI metrics stored in Prometheus should be displayed. A complete reference of all OpenTelemetry metrics and logs exported by Gemini CLI can be found in the project’s telemetry documentation on Gitub.
In Grafana, our dashboards should now show us values and graphs in the corresponding panels.
Wrapping it up: Gemini CLI Observability is more than a gimmick
At first glance, OpenTelemetry for Gemini CLI looks a bit like bringing a pedometer with you when you take a walk to the coffee machine – nice, but do you really need it? In many cases, probably not. But as soon as you run Gemini CLI in environments where it is difficult to keep track of who is using how many tokens and when – for example in automated CI/CD pipelines – the gimmick quickly becomes a practical tool.
With a few basic configuration files and containers, you end up with a usable dashboard that not only displays figures, but also gives you a feel for your own AI usage. And even if it ends up being “just” a few colorful graphs: You’re suddenly able to ask questions about your Gemini CLI usage when need arises – and that’s the beginning of observability.
Instead of a local setup, you can of course also send the metrics from Gemini CLI to production-grade observability platforms that you already use – with a few small changes you could feed the data into the Managed Prometheus App by NWS, for example. If this sounds interesting to you or you have a similar use case in mind, feel free to contact our MyEngineers® – they’d love to talk about AI and observability with you.


0 Comments