

Last week, the annual GrafanaCON took place in the USA in Seattle (Washington). Fans and users of the LGTM stack (Loki, Grafana, Tempo, Mimir) know what that means: a new Grafana release! Consequently, there is only one topic today: What’s new in Grafana 12?
As a user and provider of Grafana OSS as part of our Managed Prometheus app, we naturally followed the event, which was packed with workshops, demos and talks, very closely and can present our highlights to you today. As always, you can find a complete overview in the official release notes.
Observability as Code – Integrate Grafana (almost) however you want
One topic that came up in many demos and contributions was the introduction of a new dashboard API and the presentation of a new dashboard schema. Many of the actual features in Grafana 12, such as Git Sync or dashboard tabs, are only made possible by these changes in the background.
What’s new in Grafana 12?
Consequently, Grafana directly emphasized the new possibilities in the demos, from the already mentioned Git Sync to a new CLI and new Terraform resources. The possibilities created by these innovations are manifold, which is why we are offering a free, interactive demo that guides you through the features – feel free to try it out!
Try out the new functions in Grafana 12 in our interactive and free Playground with practical examples!
Two-Way Git Sync
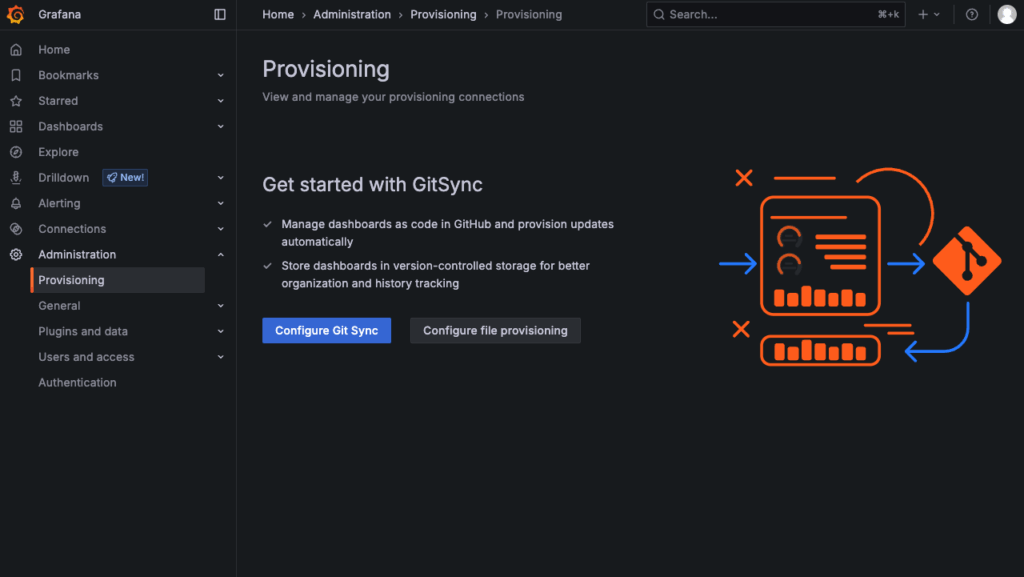
The most impressive new feature from our point of view is probably Git Sync. With its help, it is now possible to synchronize the state of the entire Grafana instance or individual dashboard folders with a configured repository in GitHub. If you are familiar with how GitOps works, this may sound familiar.
Several modes are supported:
- a complete synchronization of all folders and dashboards contained in Grafana with a GitHub repository
- selective synchronization of up to 10 dashboard folders contained in Grafana with a GitHub repository
Depending on how the Grafana instance is used, the dashboards of different teams can be synchronized with different repositories, for example, or the entire Grafana can be backed up directly as a whole.
After initial configuration, further fine adjustments can be made:
- Dashboards can be set to read-only . This means that dashboards are managed exclusively on GitHub and can no longer be edited in Grafana.
- Changes in the Grafana UI can be published as pull requests in GitHub.
- Optionally, a before/after preview of dashboard changes can be activated in pull requests.
Grafana’s UI also provides a detailed overview of the configured repositories, their synchronization status and history. We see this innovation as particularly interesting for the following use cases:
- Disaster recovery: The constant synchronization of the entire Grafana instance – or individual dashboard folders – with GitHub makes it trivial to restore the data in the event of an error. You simply relink the corresponding repository and initiate the initial synchronization.
- Audit and compliance: If you have specific processes to follow when you want to change things in Grafana, this is much easier to map in GitHub than with Grafana’s UI. Versioning, reviews and automatic tests of changes to dashboards are easy to implement in GitHub.
- Observability as code: If many of the dashboards used in Grafana are short-lived or are changed frequently, as is the case with automatically generated diagrams, for example, this approach takes a lot of work off your hands. After generation, dashboard definitions can be published on GitHub and Grafana synchronizes them automatically.
Grafana in CI/CD and in the terminal
Anyone who has ever built pipelines for Continuous Integration (CI) or Continuous Deployment (CD) knows that the “CD part” in particular often requires interaction with external systems. After all, you want to roll out the artifacts tested or generated in the pipeline. Often cURL for API calls or a dedicated CLI such as kubectl, argocd, etc. is used for this.
Grafana now also offers such a CLI: grafanactl allows you to interact with different Grafana instances in a context-based manner. The project is open source, currently available in version v0.0.6, and can be installed on Linux, macOS and Windows.
Currently, several resource types are supported, which can be pushed, pulled, edited and deleted :
- Dashboards
- LibraryPanels
- Folders
- Playlists
- Jobs
- Repositories
The range of functions of the CLI will certainly grow in the future – but it is already a practical tool for interacting with several Grafana instances (e.g. Dev and Prod), triggering changes from pipelines, etc. The documentation of the CLI including installation instructions can be found here.
New Terraform resources
The new Terraform resources are also located in the Observability as Code corner. They are based on the new Dashboards API and the new Grafana Apps Framework and offer simpler configuration, which will probably differ more from the previous resources in the future.
The new resources already available are:
Even if the current differences to existing resource types are not yet significant, it is still possible to get an idea of the direction and hope for simpler, more specific provisioning of graphic resources with Terraform.
Dynamic(r) dashboards – less is more
Grafana is a popular tool in critical situations. Whether error messages in the online store, sudden restarts of several servers or full hard disks: There are dashboards in Grafana that can help. It’s just a shame when they are confusing, contain far too many panels or data simply can’t be found.
What’s new in Grafana 12?
In order to provide more clarity, Grafana 12 has now introduced some changes for more dynamic dashboards. The focus here was primarily on the merging of panels with related content and a better display of contextual information.
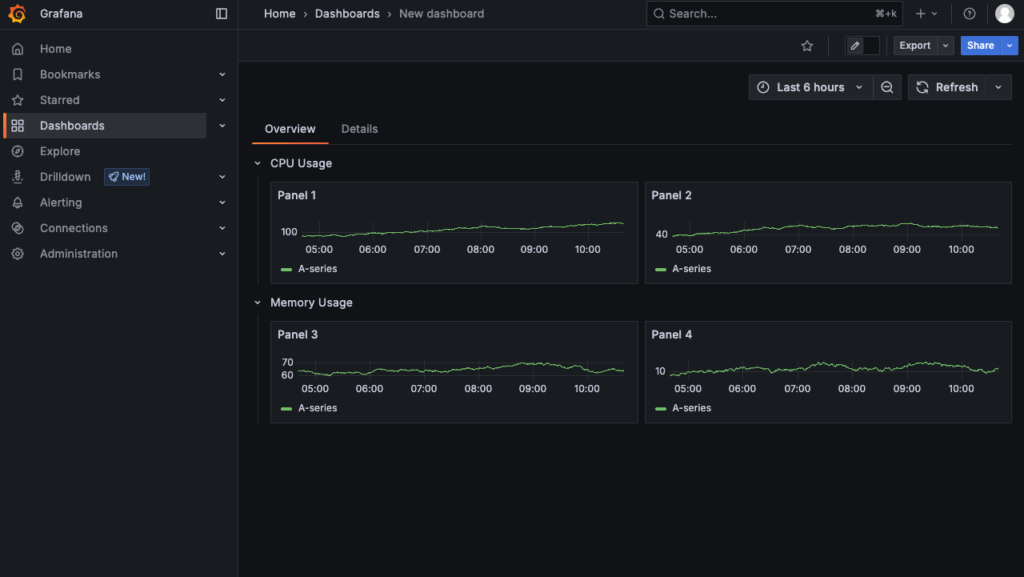
Panel groups
Several dashboard panels can be combined into rows or tabs in Grafana 12, for example to group information. Tabs and rows can be combined and nested , which offers completely new display options.
Dynamic displays
For even better context-based displays, tabs and panels can be shown or hidden depending on the variables set or the selected timer range.
For example, panel groups for visualizing long-term trends could be hidden if the current situation (e.g. an incident) requires a focus on live data and the current status of the systems.
Alternatively, panel groups that do not provide any data for set variables could be hidden.
Improved navigation and editing of dashboards
These new features can make for more intuitive, but also more extensive dashboard configurations. Grafana 12 has therefore included some improvements to the navigation and editing of dashboards.
Among other things, there is now an outline of the panel structure within a dashboard, similar to that in software IDEs. This makes it possible to maintain an overview even in nested tab-row-tab structures and quickly jump back and forth between individual groupings.
In addition, the menu for editing dashboard panels is now contextual – so you can edit rows, tabs or individual panels with just a few clicks without having to click into the corresponding submenu first.
Depending on the context, different quick actions are also available, e.g. for duplicating panel groups or customizing the layout.
Drilldown apps – keep the overview
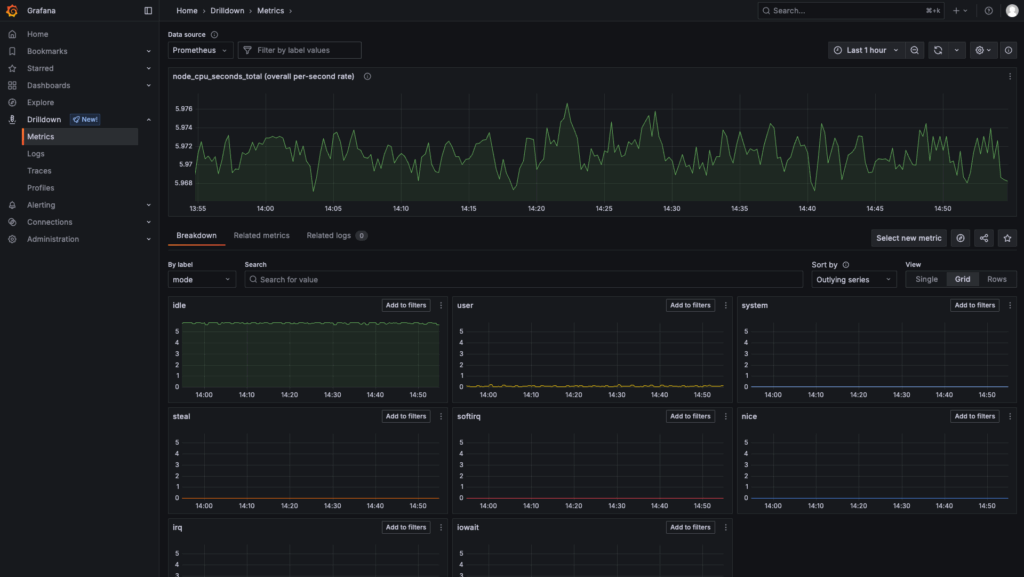
Drilldown apps were already available in one way or another before Grafana 12, but are now making a huge leap forward: Drilldown views for all observability signals (metrics, logs, traces and profiles) are available to all users with Grafana 12 and have undergone significant improvements here and there.
What’s new in Grafana 12?
The drilldown apps for metrics and logs offer new filter options, e.g. through regex support. There are also new visualization options and a new approach that does not require queries to be written(queryless).
The drilldown app for traces has now also grown out of beta status and is available to all users and can be found in the drilldown section of the main menu.
In general, further adjustments have been made to all drilldown apps to make work easier: Whether new visualizations, additional tools, e.g. for displaying JSON, or more intuitive navigation – drilldown apps enable users to visualize correlations (or differences) between different observability signals and draw conclusions from them better than ever before.
Builtin Themes – Your very own Grafana
However, the best updates not only bring new functionality and improved stability, but also something for the eye. Grafana 12 offers a first look at completely new UI designs, of which there may be more in the future.
What’s new in Grafana 12?
For now, Grafana 12 users can choose from 5 new themes in addition to the existing Light and Dark themes:
- Desert Bloom, a bright theme with light pastel tones
- Gilded Grove, a dark theme with strong contrasts
- Gloom, a warm, dark theme
- Sapphire Dusk, a dark theme in shades of blue
- Tron, a dark, futuristic theme based on the films of the same name
It should be emphasized that all new themes are experimental for the time being. There may therefore be minor shortcomings here and there in the respective themes.
Grafana 12 – an old friend in a new guise
On the whole, the question “What’s new in Grafana 12?” can be answered with “A lot!”. The new features presented here are just the tip of the iceberg – many features are not addressed at all. You can find a complete overview of all the new features, breaking changes and missing functions in the excellent release post from Grafana itself.
We are definitely looking forward to having more color and functionality in our Grafana environment in the future, as well as easier operation for many features we use every day, which will help us run MyNWS and the NETWAYS Cloud reliably.
If you would like to try out for yourself how Grafana 12 feels live and in color, we would like to recommend our interactive and free Playground once again. Otherwise, as always: See you in the next blog post from the NWS team!


0 Comments