

With our OpenStack Cloud, it is child’s play to set up your own environment according to your own ideas. Start a few machines quickly and easily using Terraform, make the service available to the outside world via an attached floating IP and associated security group and the project is up and running.
But no environment runs flawlessly and monitoring is a big issue – you like to notice in front of your own users or customers when something doesn’t quite work as it should. I think every reader of this blog is aware of the importance of monitoring, but the evaluation of performance data is also important. So how do I easily monitor my OpenStack environment, especially if my servers are not accessible from the outside world? We have prepared something for you!
In addition to our IaaS offering, we also provide various SaaS solutions, as you are no doubt aware. These include the Icinga 2 Master app, with which you can obtain a complete Icinga 2 Master, including Graphite and Grafana, in just a few minutes.
Once this has been started, you will find various integration scripts for different operating systems under the “Add Agent” tab – or “Add Agent” depending on the browser language.
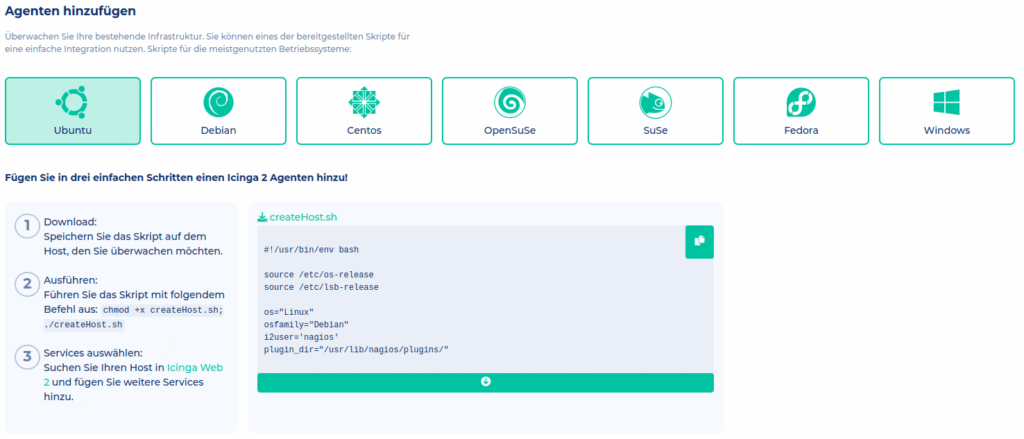
Simply load this onto the server according to the instructions, execute it and the server is connected to the Icinga2 master.
Everything important is automated here. Some checks are created directly by default and it is also easy to distribute additional checks for your hosts using the director. The API of the director can also be addressed directly, there are almost no limits. In addition, there are some graphs for the performance data of the connected agent directly with the respective check. Not only can problems be identified, but trends are also visualized directly. It should be noted that this data is stored for one year in our packages to ensure a long-term overview.
The first month of Icinga 2 Master is also free – it’s worth a test. Our MyEngineer® will also be happy to help you set it up!


0 Comments