

Neben unserer eigenen NWS AI für Recherche, Organisation und andere alltäglich anfallende Dinge bin ich in letzter Zeit ein großer Fan von Gemini CLI. Dieses Open Source Tool bringt Google’s Gemini AI in mein Terminal, sodass ich ohne Unterbrechung Fragen zu meinen Projekten und Umgebungen stellen kann.
Darüber hinaus bietet die Gemini CLI einige eingebaute Tools zur Interaktion mit meiner Umgebung , sowie Unterstützung für MCP (Model Context Protocol) Server zur Integration und Interaktion mit anderen Diensten.
Ein weiteres Feature ist der Export von OpenTelemetry Daten. Auf den ersten Blick mag das etwas seltsam erscheinen – wozu braucht man Observability für eine lokale CLI? Auf den zweiten Blick macht das ganze aber mehr Sinn.
So kann Gemini CLI bspw. in CI/CD-Pipelines genutzt werden, um Codereviews oder Zusammenfassungen vorzunehmen. In so einem Fall ist es durchaus praktisch, zu wissen, wieviele Token man denn nun in einer Pipeline genutzt hat, wieviele (und welche) Tools aufgerufen wurden, usw.
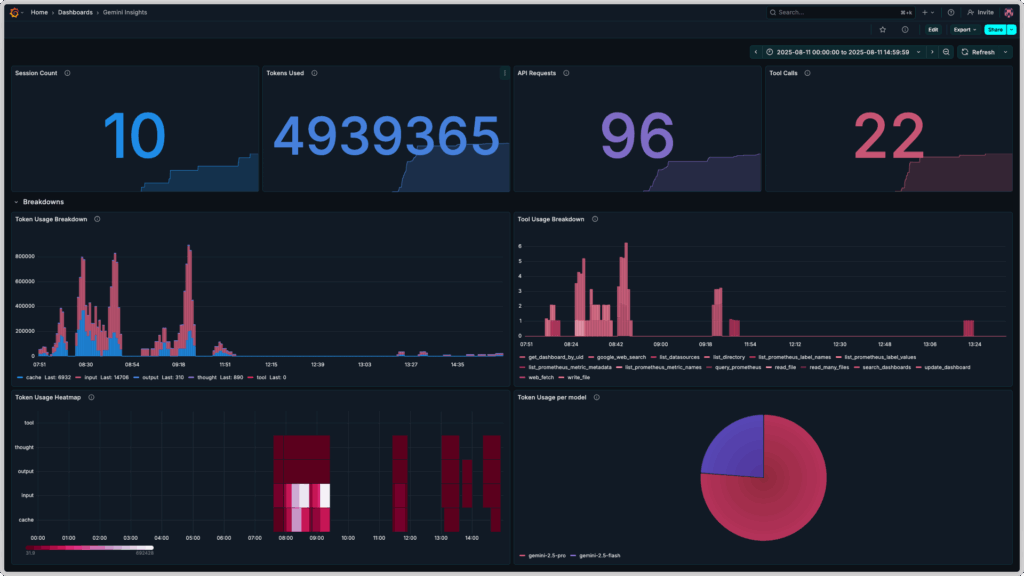
In diesem Blogpost geht es also um Gemini CLI Observability mit dem OpenTelemetry Collector, Prometheus und Grafana. Das Endresultat sieht dann in etwa so aus:
Vorbereitung
Für die Umsetzung unserer Vision von Gemini CLI Observability benötigen wir ein paar Tools auf unserem lokalen System:
- Gemini CLI
- Docker oder eine andere Container Runtime, die Docker’s
composeFormat versteht
Nach der Installation von Gemini CLI müssen wir uns erst einmal authentifizieren. Das geht auf eine von drei Möglichkeiten, die alle in der README des Projekts beschrieben sind:
- via OAuth mit Google Account (für Einzelpersonen mit oder ohne Gemini Quota)
- via Gemini API Key (für Einzelpersonen mit bezahltem Zugang zu Gemini AI)
- via Vertex API Key (für Teams und Organisationen)
Nach erfolgreicher Authentifizierung können wir die Gemini CLI – falls noch nicht geschehen – mit dem Befehl gemini starten und direkt mit Gemini AI chatten.
Konfiguration und Deployment
Für die Konfiguration und das Deployment unseres Gemini CLI Observability Projekts benötigen wir als nächstes ein paar Konfigurationsdateien sowie eine compose.yml Datei, die von Docker für die Erstellung des compose Stacks genutzt wird.
Hierfür erstellen wir ein neues Verzeichnis, z.B. gemini-telemetry, in dem wir die Dateien ablegen können.
Danach können wir mit der Konfiguration von Prometheus anfangen.
Konfiguration von Prometheus
Für Prometheus brauchen wir nur eine minimale Konfiguration – wir nutzen es lediglich als Speicher für Metriken, die vom OpenTelemetry Collector gesammelt und weitergeleitet werden. Wir speichern also folgende Konfiguration in eine Datei prometheus.yml:
global:
  scrape_interval: 15s

scrape_configs: []Zusätzlich definieren wir einen prometheus Service in einer neuen Datei compose.yml – der erste Teil unseres Gemini CLI OpenTelemetry Stacks!
services:
  prometheus:
    image: prom/prometheus:latest
    container_name: prometheus
    command:
      - '--config.file=/etc/prometheus/prometheus.yml'
      - '--storage.tsdb.path=/prometheus'
      - '--web.enable-otlp-receiver'
    ports:
      - "9090:9090"
    volumes:
      - ./prometheus.yml:/etc/prometheus/prometheus.yml
      - prometheus_data:/prometheus
    restart: unless-stopped

volumes:
prometheus_data: {}Erwähnenswert sind hier die Felder command und volumes:
Wir mappen ein Docker Volume namens prometheus-data in den Prometheus Container, um unsere gesammelten Metriken aus der Gemini CLI zu persistieren, und konfigurieren Prometheus so, dass das Senden von Metriken in OpenTelemetry’s OTLP-Format an Prometheus später auch funktioniert.
Dann geht es auch schon weiter zur Konfiguration des OpenTelemetry Collectors!
Konfiguration des OpenTelemetry Collectors
Der OpenTelemetry Collector ist für die Verarbeitung der von der Gemini CLI gesendeten Metriken zuständig. Eine gültige Collector Konfiguration besteht immer aus mindestens einem Receiver, einem Exporter, und einer oder mehrerer Pipelines.
Unsere Konfiguration otel-collector-config.yml sieht folgendermaßen aus:
receivers:
  otlp:
    protocols:
      grpc:
        endpoint: 0.0.0.0:4317

exporters:
  otlphttp:
    endpoint: "http://prometheus:9090/api/v1/otlp"

service:
  pipelines:
    metrics:
      receivers: [otlp]
exporters: [otlphttp]Zusätzlich ergänzen wir den Service otel-collector in unserer compose.yml:
services:
  prometheus:
    image: prom/prometheus:latest
    container_name: prometheus
    command:
      - '--config.file=/etc/prometheus/prometheus.yml'
      - '--storage.tsdb.path=/prometheus'
      - '--web.enable-otlp-receiver'
    ports:
      - "9090:9090"
    volumes:
      - ./prometheus.yml:/etc/prometheus/prometheus.yml
      - prometheus_data:/prometheus
    restart: unless-stopped

  otel-collector:
    image: otel/opentelemetry-collector-contrib:latest
    container_name: otel-collector
    ports:
      - "4317:4317" # OTLP gRPC
    volumes:
      - ./otel-collector-config.yml:/etc/otel/config.yml
    command:
      - '--config=/etc/otel/config.yml'
    restart: unless-stopped

volumes:
prometheus_data: {}Konfiguration von Grafana
In Grafana müssen wir für unser Gemini CLI Dashboard zwei Dinge konfigurieren:
- eine Data Source für Prometheus
- ein Dashboard für die Anzeige der gesammelten Metriken der Gemini CLI
Grafana bietet dank seines Provisioning Features die Möglichkeit, diese Konfigurationen im Vorfeld vorzunehmen. Hierfür erstellen wir zuerst die benötigte Ordnerstruktur in unserem Arbeitsverzeichnis:
mkdir -p grafana/dashboards grafana/provisioning/{datasources,dashboards}Dann erstellen wir die benötigten Dateien, jeweils eine Datasource für Dashboards und Prometheus, sowie die Dashboarddefinition selbst.
Kopiere den folgenden Inhalt in die Datei grafana/provisioning/datasources/prometheus-datasource.yml:
apiVersion: 1

datasources:
  - name: Prometheus
    type: prometheus
    access: proxy
    url: http://prometheus:9090
isDefault: trueKopiere den folgenden Inhalt in die Datei grafana/provisioning/dashboards/dashboard-provider.yml:
apiVersion: 1

providers:
  - name: 'default'
    orgId: 1
    folder: ''
    type: file
    disableDeletion: false
    editable: true
    options:
path: /var/lib/grafana/dashboardsKopiere die folgende Dashboarddefinition in die Datei grafana/dashboards/gemini-insights.json:
{
"__inputs": [
{
"name": "Prometheus",
"label": "prometheus",
"description": "",
"type": "datasource",
"pluginId": "prometheus",
"pluginName": "Prometheus"
}
],
"__elements": {},
"__requires": [
{
"type": "panel",
"id": "barchart",
"name": "Bar chart",
"version": ""
},
{
"type": "grafana",
"id": "grafana",
"name": "Grafana",
"version": "12.2.0-16890666601"
},
{
"type": "panel",
"id": "heatmap",
"name": "Heatmap",
"version": ""
},
{
"type": "panel",
"id": "piechart",
"name": "Pie chart",
"version": ""
},
{
"type": "datasource",
"id": "prometheus",
"name": "Prometheus",
"version": "1.0.0"
},
{
"type": "panel",
"id": "stat",
"name": "Stat",
"version": ""
}
],
"annotations": {
"list": [
{
"builtIn": 1,
"datasource": {
"type": "grafana",
"uid": "-- Grafana --"
},
"enable": true,
"hide": true,
"iconColor": "rgba(0, 211, 255, 1)",
"name": "Annotations & Alerts",
"type": "dashboard"
}
]
},
"description": "Insights on Gemini CLI usage",
"editable": true,
"fiscalYearStartMonth": 0,
"graphTooltip": 0,
"id": null,
"links": [],
"panels": [
{
"collapsed": false,
"gridPos": {
"h": 1,
"w": 24,
"x": 0,
"y": 0
},
"id": 5,
"panels": [],
"title": "Key Insights",
"type": "row"
},
{
"datasource": {
"type": "prometheus",
"uid": "Prometheus"
},
"description": "Number of sessions during the configured time frame.",
"fieldConfig": {
"defaults": {
"color": {
"mode": "thresholds"
},
"mappings": [],
"thresholds": {
"mode": "absolute",
"steps": [
{
"color": "#2297ea",
"value": 0
}
]
}
},
"overrides": []
},
"gridPos": {
"h": 8,
"w": 6,
"x": 0,
"y": 1
},
"id": 1,
"options": {
"colorMode": "value",
"graphMode": "area",
"justifyMode": "auto",
"orientation": "auto",
"percentChangeColorMode": "standard",
"reduceOptions": {
"calcs": [
"lastNotNull"
],
"fields": "",
"values": false
},
"showPercentChange": false,
"textMode": "auto",
"wideLayout": true
},
"pluginVersion": "12.2.0-16890666601",
"targets": [
{
"datasource": {
"type": "prometheus",
"uid": "Prometheus"
},
"editorMode": "code",
"expr": "count(present_over_time(gemini_cli_session_count_total[$__range]))",
"legendFormat": "__auto",
"range": true,
"refId": "A"
}
],
"title": "Session Count",
"type": "stat"
},
{
"datasource": {
"type": "prometheus",
"uid": "Prometheus"
},
"description": "Number of tokens used during the configured time frame.",
"fieldConfig": {
"defaults": {
"color": {
"mode": "thresholds"
},
"mappings": [],
"thresholds": {
"mode": "absolute",
"steps": [
{
"color": "#518ce1",
"value": 0
}
]
}
},
"overrides": []
},
"gridPos": {
"h": 8,
"w": 6,
"x": 6,
"y": 1
},
"id": 2,
"options": {
"colorMode": "value",
"graphMode": "area",
"justifyMode": "auto",
"orientation": "auto",
"percentChangeColorMode": "standard",
"reduceOptions": {
"calcs": [
"lastNotNull"
],
"fields": "",
"values": false
},
"showPercentChange": false,
"textMode": "auto",
"wideLayout": true
},
"pluginVersion": "12.2.0-16890666601",
"targets": [
{
"editorMode": "code",
"expr": " sum(increase(gemini_cli_token_usage_total[$__range]))",
"legendFormat": "__auto",
"range": true,
"refId": "A",
"datasource": {
"type": "prometheus",
"uid": "Prometheus"
}
}
],
"title": "Tokens Used",
"type": "stat"
},
{
"datasource": {
"type": "prometheus",
"uid": "Prometheus"
},
"description": "Number of API requests done during the configured time frame.",
"fieldConfig": {
"defaults": {
"color": {
"mode": "thresholds"
},
"decimals": 0,
"mappings": [],
"thresholds": {
"mode": "absolute",
"steps": [
{
"color": "#8b78ce",
"value": 0
}
]
},
"unit": "none"
},
"overrides": []
},
"gridPos": {
"h": 8,
"w": 6,
"x": 12,
"y": 1
},
"id": 3,
"options": {
"colorMode": "value",
"graphMode": "area",
"justifyMode": "auto",
"orientation": "auto",
"percentChangeColorMode": "standard",
"reduceOptions": {
"calcs": [
"lastNotNull"
],
"fields": "",
"values": false
},
"showPercentChange": false,
"textMode": "auto",
"wideLayout": true
},
"pluginVersion": "12.2.0-16890666601",
"targets": [
{
"editorMode": "code",
"expr": "sum(increase(gemini_cli_api_request_count_total[$__range]))",
"legendFormat": "__auto",
"range": true,
"refId": "A",
"datasource": {
"type": "prometheus",
"uid": "Prometheus"
}
}
],
"title": "API Requests",
"type": "stat"
},
{
"datasource": {
"type": "prometheus",
"uid": "Prometheus"
},
"description": "Number of tool calls during the configured time frame.",
"fieldConfig": {
"defaults": {
"color": {
"mode": "thresholds"
},
"decimals": 0,
"mappings": [],
"thresholds": {
"mode": "absolute",
"steps": [
{
"color": "#cf6180",
"value": 0
}
]
},
"unit": "none"
},
"overrides": []
},
"gridPos": {
"h": 8,
"w": 6,
"x": 18,
"y": 1
},
"id": 4,
"options": {
"colorMode": "value",
"graphMode": "area",
"justifyMode": "auto",
"orientation": "auto",
"percentChangeColorMode": "standard",
"reduceOptions": {
"calcs": [
"lastNotNull"
],
"fields": "",
"values": false
},
"showPercentChange": false,
"textMode": "auto",
"wideLayout": true
},
"pluginVersion": "12.2.0-16890666601",
"targets": [
{
"editorMode": "code",
"expr": "sum(increase(gemini_cli_tool_call_count_total[$__range]))",
"legendFormat": "__auto",
"range": true,
"refId": "A",
"datasource": {
"type": "prometheus",
"uid": "Prometheus"
}
}
],
"title": "Tool Calls",
"type": "stat"
},
{
"collapsed": false,
"gridPos": {
"h": 1,
"w": 24,
"x": 0,
"y": 9
},
"id": 8,
"panels": [],
"title": "Breakdowns",
"type": "row"
},
{
"datasource": {
"type": "prometheus",
"uid": "Prometheus"
},
"description": "Breakdown of token usage during the configured time frame. Slight inaccuracies due to extrapolation possible.",
"fieldConfig": {
"defaults": {
"color": {
"mode": "palette-classic"
},
"custom": {
"axisBorderShow": false,
"axisCenteredZero": false,
"axisColorMode": "text",
"axisLabel": "",
"axisPlacement": "auto",
"fillOpacity": 80,
"gradientMode": "none",
"hideFrom": {
"legend": false,
"tooltip": false,
"viz": false
},
"lineWidth": 1,
"scaleDistribution": {
"type": "linear"
},
"thresholdsStyle": {
"mode": "off"
}
},
"fieldMinMax": false,
"mappings": [],
"thresholds": {
"mode": "absolute",
"steps": [
{
"color": "green",
"value": 0
}
]
}
},
"overrides": [
{
"matcher": {
"id": "byName",
"options": "cache"
},
"properties": [
{
"id": "color",
"value": {
"fixedColor": "#2297ea",
"mode": "fixed"
}
}
]
},
{
"matcher": {
"id": "byName",
"options": "input"
},
"properties": [
{
"id": "color",
"value": {
"fixedColor": "#cf6180",
"mode": "fixed"
}
}
]
},
{
"matcher": {
"id": "byName",
"options": "output"
},
"properties": [
{
"id": "color",
"value": {
"fixedColor": "#518ce1",
"mode": "fixed"
}
}
]
},
{
"matcher": {
"id": "byName",
"options": "thought"
},
"properties": [
{
"id": "color",
"value": {
"fixedColor": "#8b78ce",
"mode": "fixed"
}
}
]
}
]
},
"gridPos": {
"h": 11,
"w": 12,
"x": 0,
"y": 10
},
"id": 6,
"options": {
"barRadius": 0,
"barWidth": 0.97,
"fullHighlight": false,
"groupWidth": 0.7,
"legend": {
"calcs": [
"last"
],
"displayMode": "list",
"placement": "bottom",
"showLegend": true
},
"orientation": "auto",
"showValue": "never",
"stacking": "normal",
"tooltip": {
"hideZeros": false,
"mode": "single",
"sort": "none"
},
"xTickLabelRotation": 0,
"xTickLabelSpacing": 100
},
"pluginVersion": "12.2.0-16890666601",
"targets": [
{
"editorMode": "code",
"expr": "sum by(type)(increase(gemini_cli_token_usage_total[$__rate_interval]))",
"legendFormat": "__auto",
"range": true,
"refId": "A",
"datasource": {
"type": "prometheus",
"uid": "Prometheus"
}
}
],
"title": "Token Usage Breakdown",
"type": "barchart"
},
{
"datasource": {
"type": "prometheus",
"uid": "Prometheus"
},
"description": "Breakdown of tool usage during the configured time frame. Slight inaccuracies due to extrapolation possible.",
"fieldConfig": {
"defaults": {
"color": {
"fixedColor": "#cf6180",
"mode": "shades"
},
"custom": {
"axisBorderShow": false,
"axisCenteredZero": false,
"axisColorMode": "text",
"axisLabel": "",
"axisPlacement": "auto",
"fillOpacity": 80,
"gradientMode": "none",
"hideFrom": {
"legend": false,
"tooltip": false,
"viz": false
},
"lineWidth": 1,
"scaleDistribution": {
"type": "linear"
},
"thresholdsStyle": {
"mode": "off"
}
},
"fieldMinMax": false,
"mappings": [],
"thresholds": {
"mode": "absolute",
"steps": [
{
"color": "green",
"value": 0
}
]
}
},
"overrides": []
},
"gridPos": {
"h": 11,
"w": 12,
"x": 12,
"y": 10
},
"id": 7,
"options": {
"barRadius": 0,
"barWidth": 0.97,
"fullHighlight": false,
"groupWidth": 0.7,
"legend": {
"calcs": [],
"displayMode": "list",
"placement": "bottom",
"showLegend": true
},
"orientation": "auto",
"showValue": "never",
"stacking": "normal",
"tooltip": {
"hideZeros": false,
"mode": "single",
"sort": "none"
},
"xTickLabelRotation": 0,
"xTickLabelSpacing": 100
},
"pluginVersion": "12.2.0-16890666601",
"targets": [
{
"editorMode": "code",
"expr": "sum by (function_name)(increase(gemini_cli_tool_call_count_total[$__rate_interval]))",
"legendFormat": "__auto",
"range": true,
"refId": "A",
"datasource": {
"type": "prometheus",
"uid": "Prometheus"
}
}
],
"title": "Tool Usage Breakdown",
"type": "barchart"
},
{
"datasource": {
"type": "prometheus",
"uid": "Prometheus"
},
"description": "Displays token usage by token type as a headmap",
"fieldConfig": {
"defaults": {
"custom": {
"hideFrom": {
"legend": false,
"tooltip": false,
"viz": false
},
"scaleDistribution": {
"type": "linear"
}
}
},
"overrides": []
},
"gridPos": {
"h": 11,
"w": 12,
"x": 0,
"y": 21
},
"id": 9,
"interval": "5m",
"options": {
"calculate": false,
"cellGap": 1,
"color": {
"exponent": 0.5,
"fill": "dark-orange",
"mode": "scheme",
"reverse": false,
"scale": "exponential",
"scheme": "PuRd",
"steps": 16
},
"exemplars": {
"color": "rgba(255,0,255,0.7)"
},
"filterValues": {
"le": 1e-9
},
"legend": {
"show": true
},
"rowsFrame": {
"layout": "auto"
},
"tooltip": {
"mode": "single",
"showColorScale": false,
"yHistogram": false
},
"yAxis": {
"axisPlacement": "left",
"reverse": false,
"unit": "dateTimeAsLocal"
}
},
"pluginVersion": "12.2.0-16890666601",
"targets": [
{
"editorMode": "code",
"expr": "sum by (type) (increase(gemini_cli_token_usage_total[$__rate_interval]))",
"legendFormat": "__auto",
"range": true,
"refId": "A",
"datasource": {
"type": "prometheus",
"uid": "Prometheus"
}
}
],
"title": "Token Usage Heatmap",
"type": "heatmap"
},
{
"datasource": {
"type": "prometheus",
"uid": "Prometheus"
},
"description": "Breakdown of token usage per model during the configured time frame. Slight inaccuracies due to extrapolation possible.",
"fieldConfig": {
"defaults": {
"color": {
"mode": "palette-classic"
},
"custom": {
"hideFrom": {
"legend": false,
"tooltip": false,
"viz": false
}
},
"mappings": []
},
"overrides": [
{
"matcher": {
"id": "byName",
"options": "gemini-2.5-flash"
},
"properties": [
{
"id": "color",
"value": {
"fixedColor": "#8b78ce",
"mode": "fixed"
}
}
]
},
{
"matcher": {
"id": "byName",
"options": "gemini-2.5-pro"
},
"properties": [
{
"id": "color",
"value": {
"fixedColor": "#cf6180",
"mode": "fixed"
}
}
]
}
]
},
"gridPos": {
"h": 11,
"w": 12,
"x": 12,
"y": 21
},
"id": 10,
"options": {
"legend": {
"displayMode": "list",
"placement": "bottom",
"showLegend": true
},
"pieType": "pie",
"reduceOptions": {
"calcs": [
"lastNotNull"
],
"fields": "",
"values": false
},
"tooltip": {
"hideZeros": false,
"mode": "single",
"sort": "none"
}
},
"pluginVersion": "12.2.0-16890666601",
"targets": [
{
"editorMode": "code",
"expr": "sum by (model) (increase(gemini_cli_token_usage_total[$__range]))",
"legendFormat": "__auto",
"range": true,
"refId": "A",
"datasource": {
"type": "prometheus",
"uid": "Prometheus"
}
}
],
"title": "Token Usage per model",
"type": "piechart"
}
],
"schemaVersion": 41,
"tags": [],
"templating": {
"list": []
},
"time": {
"from": "now-3h",
"to": "now"
},
"timepicker": {},
"timezone": "browser",
"title": "Gemini Insights",
"uid": "mam5ksd",
"version": 10,
"weekStart": ""
}
Nachdem wir die drei benötigten Dateien angelegt haben, können wir unserer compose.yml einen dritten Service namens grafana hinzufügen:
services:
  prometheus:
    image: prom/prometheus:latest
    container_name: prometheus
    command:
      - '--config.file=/etc/prometheus/prometheus.yml'
      - '--storage.tsdb.path=/prometheus'
      - '--web.enable-otlp-receiver'
    ports:
      - "9090:9090"
    volumes:
      - ./prometheus.yml:/etc/prometheus/prometheus.yml
      - prometheus_data:/prometheus
    restart: unless-stopped

  otel-collector:
    image: otel/opentelemetry-collector-contrib:latest
    container_name: otel-collector
    ports:
      - "4317:4317" # OTLP gRPC
    volumes:
      - ./otel-collector-config.yml:/etc/otel/config.yml
    command:
      - '--config=/etc/otel/config.yml'
    restart: unless-stopped

  grafana:
    image: grafana/grafana:latest
    container_name: grafana
    ports:
      - "3000:3000"
    volumes:
      - ./grafana/provisioning/datasources:/etc/grafana/provisioning/datasources
      - ./grafana/provisioning/dashboards:/etc/grafana/provisioning/dashboards
      - ./grafana/dashboards:/var/lib/grafana/dashboards
    restart: unless-stopped
    depends_on:
      - prometheus

volumes:
prometheus_data: {}Deployment des Gemini CLI OpenTelemetry Stacks
Unsere compose.yml ist damit fertig, und wir können den Stack mit Docker starten:
docker compose up -dIm Anschluss können wir testen, ob die Anwendungen verfügbar sind – Prometheus sollte unter http://localhost:9090 verfügbar sein, Grafana unter http://localhost:3000 (die Zugangsdaten sind hier admin für Nutzername und Passwort).
In Grafana sollten wir unter Dashboards bereits das Dashboard Gemini Insights sehen können. Allerdings zeigen die Panels des Dashboards momentan alle No Data an – Gemini CLI ist schließlich noch nicht für den Export von OpenTelemetry Metriken konfiguriert. Das ist der letzte Schritt auf dieser Reise zu Gemini CLI Observability.
Konfiguration von Gemini CLI
Gemini CLI lässt sich über Dateien an verschiedenen Stellen auf unserem System konfigurieren:
- nutzerspezifische Konfiguration unter
$HOME/.gemini/settings.json - projektspezifische Konfiguration unter
./.gemini/settings.json - systemweite Konfiguration, z.B. unter
/etc/gemini-cli/settings.jsonauf Linuxsystemen
Einträge weiter unten in der Liste überschreiben Einträge weiter oben. Genauere Informationen finden sich in der Konfigurationsdokumentation des Projekts auf GitHub.
Für unseren Fall wäre es sinnvoll, wenn die Gemini CLI für jede Session in unserem Nutzerkontext OpenTelemetry Metriken exportiert. Wir erstellen (oder editieren) also die Datei $HOME/.gemini/settings.json und fügen folgenden Abschnitt hinzu:
"telemetry": {
  "enabled": true,
  "target": "local",
  "otlpEndpoint": "http://localhost:4317",
  "logPrompts": true
}Im Anschluss können wir eine neue Session in der Gemini CLI starten und uns etwas mit Gemini unterhalten – beispielsweise um eine Zusammenfassung unseres Arbeitsverzeichnisses für diesen Blogpost zu erhalten. Nach 1-2 Minuten sollten dann Daten in Prometheus landen und somit auch in unserem Dashboard in Grafana auftauchen.
In Prometheus können wir das testen, indem wir in das Abfragefeld der Prometheus UI gemini_cli eingeben. Eine Liste aller in Prometheus gespeicherten Metriken sollte angezeigt werden. Eine komplette Referenz aller von Gemini CLI exportierten OpenTelemetry Metriken und Logs findet sich in der Telemetrydokumentation des Projekts auf Gitub.
In Grafana sollte unser Dashboards uns nun Werte und Graphen in den entsprechenden Panels anzeigen.
Zusammengefasst: Gemini CLI Observability ist nicht schwer
Auf den ersten Blick wirkt OpenTelemetry für Gemini CLI ein bisschen wie ein Schrittzähler beim Gang zur Kaffeemaschine – nett, aber braucht man das wirklich? In vielen Fällen wohl nicht. Doch sobald Gemini CLI in Umgebungen läuft, in denen man kaum noch überblickt, wer wann wie viele Tokens verbraucht – etwa in automatisierten CI/CD-Pipelines – wird aus dem Gimmick schnell ein praktisches Werkzeug.
Mit ein paar Konfigurationsdateien und Containern landet man bei einem schicken Dashboard, das nicht nur Zahlen anzeigt, sondern auch ein Gefühl für die eigene AI-Nutzung vermittelt. Und selbst wenn es am Ende „nur“ ein paar bunte Graphen sind: Man weiß plötzlich Dinge, die man vorher nicht wusste – und genau das ist ja der Anfang von Observability.
Statt einem lokalen Setup kann man die Metriken von Gemini CLI natürlich auch in produktive Observability Plattformen senden, die man sowieso schon nutzt – mit ein paar kleinen Änderungen könnte man die Daten z.B. in die Managed Prometheus App von NWS einspeisen. Wenn das für dich interessant klingt oder du einen ähnlichen Anwendungsfall im Sinn hast, kontaktiere gerne unsere MyEngineers®.


0 Kommentare