Select Page

Resizing Persistent Volumes in Kubernetes

by | Jul 12, 2022

You want to resize a PersistentVolume (PV) in Kubernetes? In this tutorial, you’ll learn how to do it. If you don’t already know what a PV is and how you can create one, you should check out the tutorial Creating Persistent Volumes in Kubernetes first.


Let’s resize

Resizing a PV is not a big deal. Make sure that you edit the PersistentVolumeClaim and NOT the PersistentVolume object. The PVC object can be edited with the command kubectl edit. If you have gone through the tutorial mentioned before, you have a PVC object in your cluster which name is nginx-documentroot. We will increase the size of the corresponding volume from 1 GiB to 5 GiB by editing the PVC object:

$ kubectl edit pvc nginx-documentroot

Your default editor will be opened and it will show the yaml-representation of the PVC object. You can now change the volume size under .spec.resources.requests.storage.


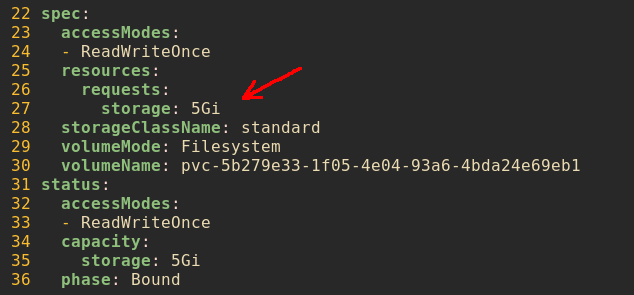
After saving and exiting the editor, the volume resize takes place. The default StorageClass (Cinder) in NWS Managed Kubernetes clusters supports Online Expansion, i.e. the filesystem on the volume is resized, if it is mounted to a running pod. This means you don’t have to restart your pods to make the extra storage available to your container applications. Note that decreasing the size of an existing volume is not possible. The Kubernetes-API doesn’t even allow it.

To make sure that the resize was successful, you can take a look at the PVC and the PV objects:


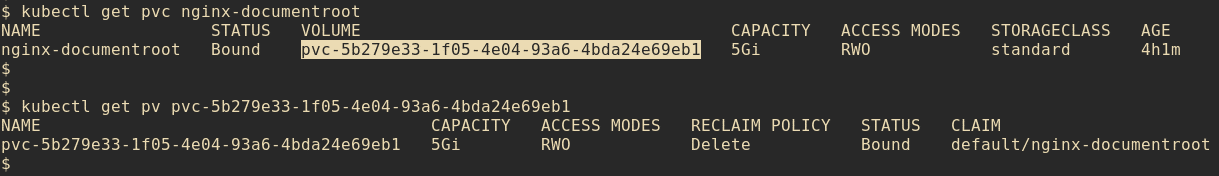
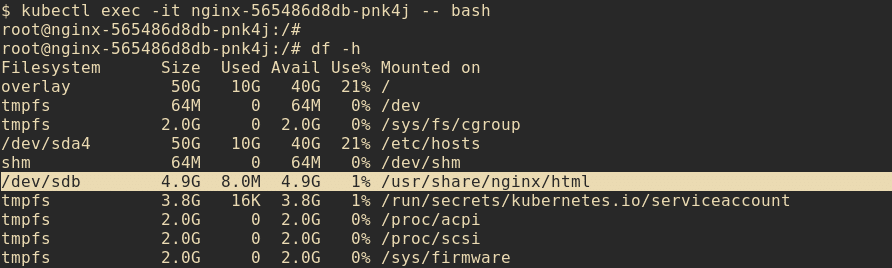
The PV was updated so that both objects now show the capacity of 5 GiB. To be completely sure that the resize worked you can kubectl exec into the container that mounts the PV:


Further helpful information

This little tutorial showed you how to resize PersistentVolumes. But how do you know when it’s time to do a resize? The Kube Prometheus Stack is a great tool to monitor the disk usage of all the PVs in your cluster. If you want to get notifications as soon as the disk usage on a volume exceeds a certain limit, you might find the tutorial Kubernetes Alerting with Prometheus Alertmanager helpful.

Don’t miss our newsletter
More about Kubernetes
Mastering Kubernetes with Cilium: Empowering L7 Traffic Control

Mastering Kubernetes with Cilium: Empowering L7 Traffic Control

With the new release of the Cilium CNI on our Kubernetes Service you'll get the ability to filter traffic based on L7 properties. It's very powerful and can help a lot with your services security. In this tutorial, we'll be securing an API endpoint to allow access...

ReadWriteMany (RWX) with the NFS Ganesha Provisioner

ReadWriteMany (RWX) with the NFS Ganesha Provisioner

Introduction You have the desire that your application needs to scale across multiple nodes for load balancing, but needs access to a common PVC? For this purpose, you need a PVC that is RWX-enabled. As part of our Managed Kubernetes Cluster, it is possible to create...

Custom Connection Limit for Load Balancers

Custom Connection Limit for Load Balancers

You need to set a custom limit for incoming connections on your load balancer? Here you can learn how to achieve this! About the Connection Limit The connection limit specifies the maximum allowed number of connections per second for a load balancer listener (open...

Automatic Fedora CoreOS Updates for your Kubernetes

Automatic Fedora CoreOS Updates for your Kubernetes

You want automated Fedora CoresOS updates for your Kubernetes? And what do Zincati and libostree have to do with it? Here you will quickly see an overview! Fedora CoreOS is used as the operating system for many Kubernetes clusters. This operating system, which...

X-Forwarded-For and Proxy-Protocol

X-Forwarded-For and Proxy-Protocol

You want to know how to get the IP addresses of your clients in your Kubernetes cluster? In five minutes you have an overview! From HTTP client to application In the nginx-Ingress-Controller tutorial, we showed how to make an application publicly accessible. In the...

Kubernetes Alerting with Prometheus Alert manager

Kubernetes Alerting with Prometheus Alert manager

In a previous post, Sebastian explained how to monitor your Kubernetes cluster with the Prometheus Operator. This post builds on that and shows how to set up notifications via email and as push notifications with the Alert Manager. Install the Monitoring Stack with...

Logging with Loki and Grafana in Kubernetes

Logging with Loki and Grafana in Kubernetes

You already know the most important building blocks for starting your application from our Tutorial-Serie. Are you still missing metrics and logs for your applications? After this blog post, you can tick off the latter. Logging with Loki and Grafana in Kubernetes - an...

Manage Kubernetes Nodegroups

Manage Kubernetes Nodegroups

As of this week, our customers can use the "node group feature" for their NWS Managed Kubernetes Cluster plan. What are node groups and what can I do with them? Our seventh blog post in the series explains this and more. What are Node Groups? With node groups, it is...

Creating Persistent Volumes in Kubernetes

Creating Persistent Volumes in Kubernetes

You want to create a persistent volume in Kubernetes? Here you can learn how it works with Openstack Cinder in a NWS Managed Kubernetes plan. Pods and containers are by definition more or less ephemeral components in a Kubernetes cluster and are created and destroyed...

Monitoring Kubernetes with Prometheus

Monitoring Kubernetes with Prometheus

Monitoring - for many a certain love-hate relationship. Some like it, others despise it. I am one of those who tend to despise it, but then grumble when you can't see certain metrics and information. Regardless of personal preferences on the subject, however, the...