Monitoring – for many a certain love-hate relationship. Some like it, others despise it. I am one of those who tend to despise it, but then grumble when you can’t see certain metrics and information. Regardless of personal preferences on the subject, however, the consensus of everyone is certain: monitoring is important and a setup is only as good as the monitoring that goes with it.
Anyone who wants to develop and operate their applications on the basis of Kubernetes will inevitably ask themselves sooner or later how they can monitor these applications and the Kubernetes cluster. One variant is the use of the monitoring solution Prometheus; more precisely, by using the Kubernetes Prometheus Operator. An exemplary and functional solution is shown in this blog post.
Kubernetes Operator
Kubernetes operators are, in short, extensions that can be used to create your own resource types. In addition to the standard Kubernetes resources such as Pods, DaemonSets, Services, etc., you can also use your own resources with the help of an operator. In our example, the following are new: Prometheus, ServiceMonitor and others. Operators are of great use when you need to perform special manual tasks for your application in order to run it properly. This could be, for example, database schema updates during version updates, special backup jobs or controlling events in distributed systems. As a rule, operators – like ordinary applications – run as containers within the cluster.
How does it work?
The basic idea is that the Prometheus Operator is used to start one or many Prometheus instances, which in turn are dynamically configured by the ServiceMonitor. This means that an ordinary Kubernetes service can be docked with a ServiceMonitor, which in turn can also read out the endpoints and configure the associated Prometheus instance accordingly. If the service or the endpoints change, for example in number or the endpoints have new IPs, the ServiceMonitor recognises this and reconfigures the Prometheus instance each time. In addition, a manual configuration can also be carried out via configmaps.
Requirements
The prerequisite is a functioning Kubernetes cluster. For the following example, I use an NWS Managed Kubernetes Cluster in version 1.16.2.
Installation of Prometheus Operator
First, the Prometheus operator is provided. A deployment, a required ClusterRole with associated ClusterRoleBinding and a ServiceAccount are defined.
apiVersion: rbac.authorization.k8s.io/v1
kind: ClusterRoleBinding
metadata:
  labels:
    app.kubernetes.io/component: controller
    app.kubernetes.io/name: prometheus-operator
    app.kubernetes.io/version: v0.38.0
  name: prometheus-operator
roleRef:
  apiGroup: rbac.authorization.k8s.io
  kind: ClusterRole
  name: prometheus-operator
subjects:
- kind: ServiceAccount
  name: prometheus-operator
  namespace: default
---
apiVersion: rbac.authorization.k8s.io/v1
kind: ClusterRole
metadata:
  labels:
    app.kubernetes.io/component: controller
    app.kubernetes.io/name: prometheus-operator
    app.kubernetes.io/version: v0.38.0
  name: prometheus-operator
rules:
- apiGroups:
  - apiextensions.k8s.io
  resources:
  - customresourcedefinitions
  verbs:
  - create
- apiGroups:
  - apiextensions.k8s.io
  resourceNames:
  - alertmanagers.monitoring.coreos.com
  - podmonitors.monitoring.coreos.com
  - prometheuses.monitoring.coreos.com
  - prometheusrules.monitoring.coreos.com
  - servicemonitors.monitoring.coreos.com
  - thanosrulers.monitoring.coreos.com
  resources:
  - customresourcedefinitions
  verbs:
  - get
  - update
- apiGroups:
  - monitoring.coreos.com
  resources:
  - alertmanagers
  - alertmanagers/finalizers
  - prometheuses
  - prometheuses/finalizers
  - thanosrulers
  - thanosrulers/finalizers
  - servicemonitors
  - podmonitors
  - prometheusrules
  verbs:
  - '*'
- apiGroups:
  - apps
  resources:
  - statefulsets
  verbs:
  - '*'
- apiGroups:
  - ""
  resources:
  - configmaps
  - secrets
  verbs:
  - '*'
- apiGroups:
  - ""
  resources:
  - pods
  verbs:
  - list
  - delete
- apiGroups:
  - ""
  resources:
  - services
  - services/finalizers
  - endpoints
  verbs:
  - get
  - create
  - update
  - delete
- apiGroups:
  - ""
  resources:
  - nodes
  verbs:
  - list
  - watch
- apiGroups:
  - ""
  resources:
  - namespaces
  verbs:
  - get
  - list
  - watch
---
apiVersion: apps/v1
kind: Deployment
metadata:
  labels:
    app.kubernetes.io/component: controller
    app.kubernetes.io/name: prometheus-operator
    app.kubernetes.io/version: v0.38.0
  name: prometheus-operator
  namespace: default
spec:
  replicas: 1
  selector:
    matchLabels:
      app.kubernetes.io/component: controller
      app.kubernetes.io/name: prometheus-operator
  template:
    metadata:
      labels:
        app.kubernetes.io/component: controller
        app.kubernetes.io/name: prometheus-operator
        app.kubernetes.io/version: v0.38.0
    spec:
      containers:
      - args:
        - --kubelet-service=kube-system/kubelet
        - --logtostderr=true
        - --config-reloader-image=jimmidyson/configmap-reload:v0.3.0
        - --prometheus-config-reloader=quay.io/coreos/prometheus-config-reloader:v0.38.0
        image: quay.io/coreos/prometheus-operator:v0.38.0
        name: prometheus-operator
        ports:
        - containerPort: 8080
          name: http
        resources:
          limits:
            cpu: 200m
            memory: 200Mi
          requests:
            cpu: 100m
            memory: 100Mi
        securityContext:
          allowPrivilegeEscalation: false
      nodeSelector:
        beta.kubernetes.io/os: linux
      securityContext:
        runAsNonRoot: true
        runAsUser: 65534
      serviceAccountName: prometheus-operator
---
apiVersion: v1
kind: ServiceAccount
metadata:
  labels:
    app.kubernetes.io/component: controller
    app.kubernetes.io/name: prometheus-operator
    app.kubernetes.io/version: v0.38.0
  name: prometheus-operator
  namespace: default
---
apiVersion: v1
kind: Service
metadata:
  labels:
    app.kubernetes.io/component: controller
    app.kubernetes.io/name: prometheus-operator
    app.kubernetes.io/version: v0.38.0
  name: prometheus-operator
  namespace: default
spec:
  clusterIP: None
  ports:
  - name: http
    port: 8080
    targetPort: http
  selector:
    app.kubernetes.io/component: controller
    app.kubernetes.io/name: prometheus-operator
kubectl apply -f 00-prometheus-operator.yaml
clusterrolebinding.rbac.authorization.k8s.io/prometheus-operator created
clusterrole.rbac.authorization.k8s.io/prometheus-operator created
deployment.apps/prometheus-operator created
serviceaccount/prometheus-operator created
service/prometheus-operator created
Role Based Access Control
In addition, corresponding Role Based Access Control (RBAC) policies are required. The Prometheus instances (StatefulSets), started by the Prometheus operator, start containers under the service account of the same name “Prometheus”. This account needs read access to the Kubernetes API in order to be able to read out the information about services and endpoints later.
Clusterrole
apiVersion: rbac.authorization.k8s.io/v1beta1
kind: ClusterRole
metadata:
  name: prometheus
rules:
- apiGroups: [""]
  resources:
  - nodes
  - services
  - endpoints
  - pods
  verbs: ["get", "list", "watch"]
- apiGroups: [""]
  resources:
  - configmaps
  verbs: ["get"]
- nonResourceURLs: ["/metrics"]
  verbs: ["get"]
kubectl apply -f 01-clusterrole.yaml
clusterrole.rbac.authorization.k8s.io/prometheus created
ClusterRoleBinding
apiVersion: rbac.authorization.k8s.io/v1beta1
kind: ClusterRoleBinding
metadata:
  name: prometheus
roleRef:
  apiGroup: rbac.authorization.k8s.io
  kind: ClusterRole
  name: prometheus
subjects:
- kind: ServiceAccount
  name: prometheus
  namespace: default
kubectl apply -f 01-clusterrolebinding.yaml
clusterrolebinding.rbac.authorization.k8s.io/prometheus created
ServiceAccount
apiVersion: v1
kind: ServiceAccount
metadata:
  name: prometheus
kubectl apply -f 01-serviceaccount.yaml
serviceaccount/prometheus created
Monitoring Kubernetes Cluster Nodes
There are various metrics that can be read from a Kubernetes cluster. In this example, we will initially only look at the system values of the Kubernetes nodes. The “Node Exporter” software, also provided by the Prometheus project, can be used to monitor the Kubernetes cluster nodes. This reads out all metrics about CPU, memory and I/O and makes these values available for retrieval under /metrics. Prometheus itself later “crawls” these metrics at regular intervals. A DaemonSet controls that one container/pod at a time is started on a Kubernetes node. With the help of the service, all endpoints are combined under one cluster IP.
apiVersion: apps/v1
kind: DaemonSet
metadata:
  name: node-exporter
spec:
  selector:
    matchLabels:
      app: node-exporter
  template:
    metadata:
      labels:
        app: node-exporter
      name: node-exporter
    spec:
      hostNetwork: true
      hostPID: true
      containers:
      - image: quay.io/prometheus/node-exporter:v0.18.1
        name: node-exporter
        ports:
        - containerPort: 9100
          hostPort: 9100
          name: scrape
        resources:
          requests:
            memory: 30Mi
            cpu: 100m
          limits:
            memory: 50Mi
            cpu: 200m
        volumeMounts:
        - name: proc
          readOnly:  true
          mountPath: /host/proc
        - name: sys
          readOnly: true
          mountPath: /host/sys
      volumes:
      - name: proc
        hostPath:
          path: /proc
      - name: sys
        hostPath:
          path: /sys
---
apiVersion: v1
kind: Service
metadata:
  labels:
    app: node-exporter
  annotations:
    prometheus.io/scrape: 'true'
  name: node-exporter
spec:
  ports:
  - name: metrics
    port: 9100
    protocol: TCP
  selector:
    app: node-exporter
kubectl apply -f 02-exporters.yaml
daemonset.apps/node-exporter created
service/node-exporter created
Service Monitor
With the so-called third party resource “ServiceMonitor”, provided by the Prometheus operator, it is possible to include the previously started service, in our case node-exporter, for future monitoring. The TPR itself receives a label team: frontend, which in turn is later used as a selector for the Prometheus instance.
apiVersion: monitoring.coreos.com/v1
kind: ServiceMonitor
metadata:
  name: node-exporter
  labels:
    team: frontend
spec:
  selector:
    matchLabels:
      app: node-exporter
  endpoints:
  - port: metrics
kubectl apply -f 03-service-monitor-node-exporter.yaml
servicemonitor.monitoring.coreos.com/node-exporter created
Prometheus Instance
A Prometheus instance is defined, which now collects all services based on the labels and obtains the metrics from their endpoints.
apiVersion: monitoring.coreos.com/v1
kind: Prometheus
metadata:
  name: prometheus
spec:
  serviceAccountName: prometheus
  serviceMonitorSelector:
    matchLabels:
      team: frontend
  resources:
    requests:
      memory: 400Mi
  enableAdminAPI: false
kubectl apply -f 04-prometheus-service-monitor-selector.yaml
prometheus.monitoring.coreos.com/prometheus created
Prometheus Service
The started Prometheus instance is exposed with a service object. After a short waiting time, a cloud load balancer is started that can be reached from the internet and passes through requests to our Prometheus instance.
apiVersion: v1
kind: Service
metadata:
  name: prometheus
spec:
  type: LoadBalancer
  ports:
  - name: web
    port: 9090
    protocol: TCP
    targetPort: web
  selector:
    prometheus: prometheus
kubectl apply -f 05-prometheus-service.yaml
service/prometheus created


kubectl get services
NAME         TYPE           CLUSTER-IP       EXTERNAL-IP   PORT(S)          AGE
prometheus   LoadBalancer   10.254.146.112    pending      9090:30214/TCP   58s
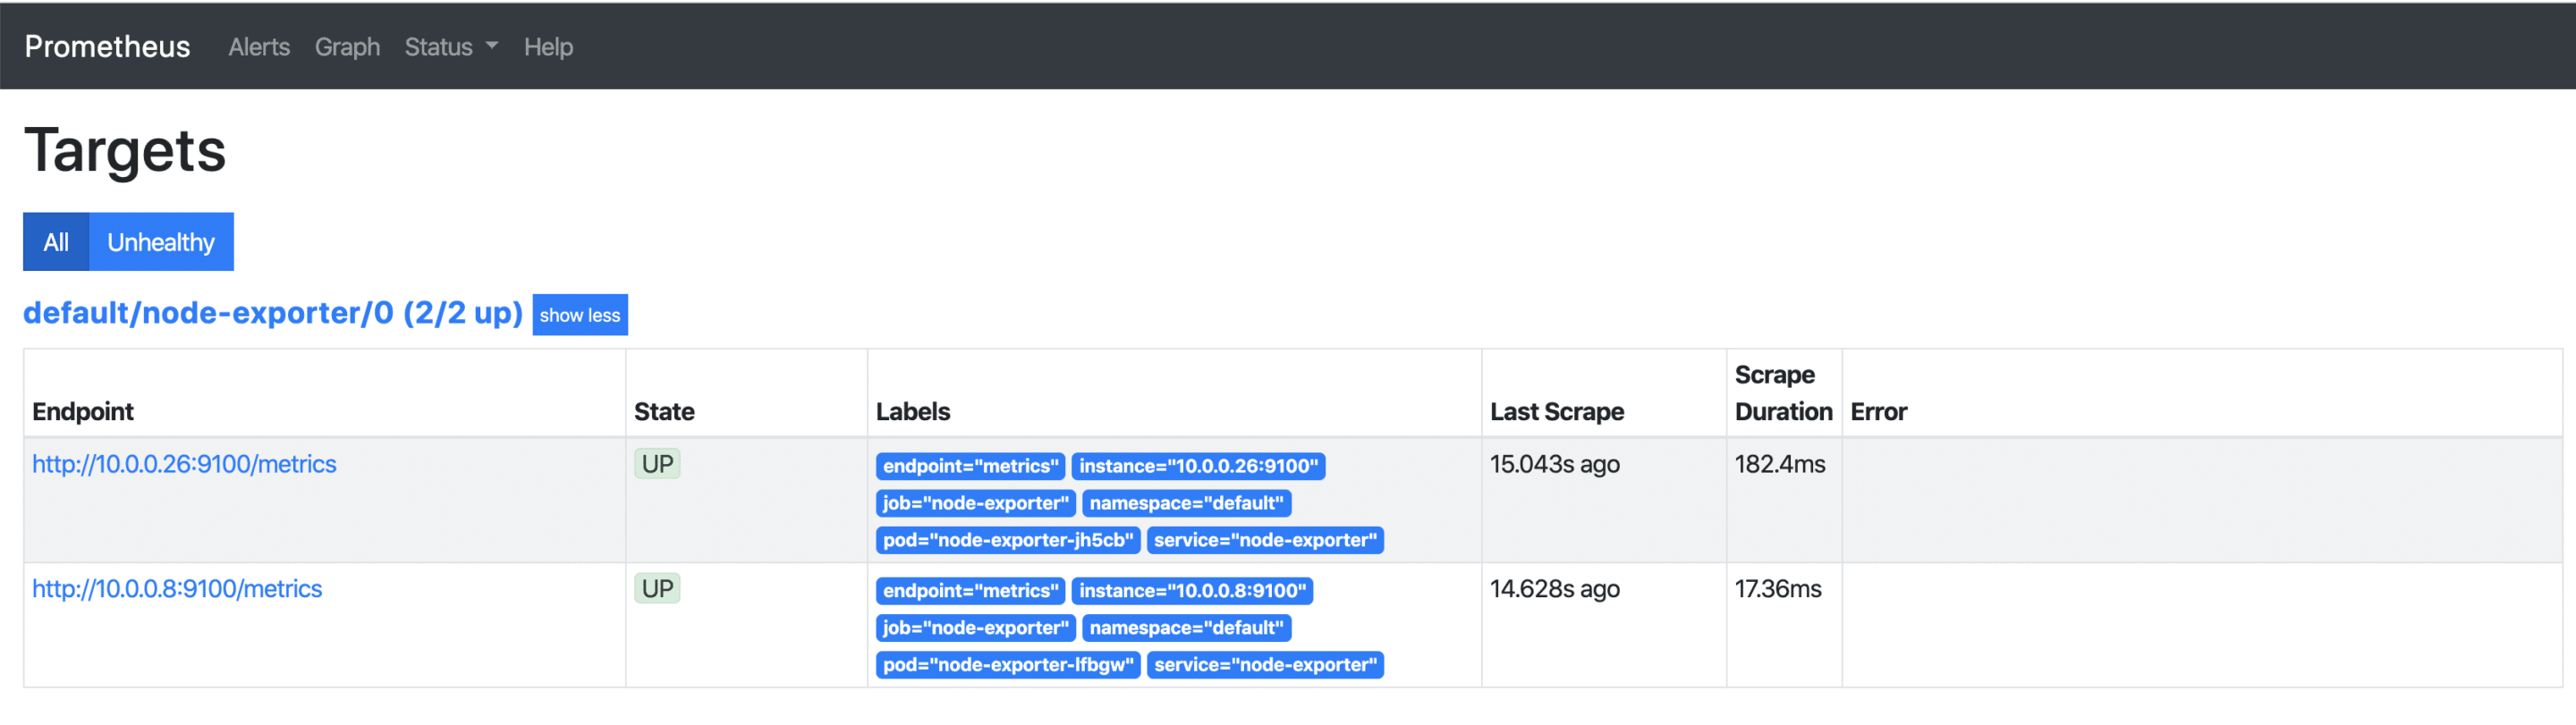
As soon as the external IP address is available, it can be accessed via http://x.x.x.x:9090/targets and you can see all your Kubernetes nodes, whose metrics will be retrieved regularly from now on. If additional nodes are added later, they are automatically included or removed again.
Visualisation with Grafana
The collected metrics can be easily and nicely visualised with Grafana. Grafana is an analysis tool that supports various data backends.
apiVersion: v1
kind: Service
metadata:
  name: grafana
spec:
#  type: LoadBalancer
  ports:
  - port: 3000
    targetPort: 3000
  selector:
    app: grafana
---
apiVersion: apps/v1
kind: Deployment
metadata:
  labels:
    app: grafana
  name: grafana
spec:
  selector:
    matchLabels:
      app: grafana
  replicas: 1
  revisionHistoryLimit: 2
  template:
    metadata:
      labels:
        app: grafana
    spec:
      containers:
      - image: grafana/grafana:latest
        name: grafana
        imagePullPolicy: Always
        ports:
        - containerPort: 3000
        env:
          - name: GF_AUTH_BASIC_ENABLED
            value: "false"
          - name: GF_AUTH_ANONYMOUS_ENABLED
            value: "true"
          - name: GF_AUTH_ANONYMOUS_ORG_ROLE
            value: Admin
          - name: GF_SERVER_ROOT_URL
            value: /api/v1/namespaces/default/services/grafana/proxy/
kubectl apply -f grafana.yaml
service/grafana created
deployment.apps/grafana created


kubectl proxy
Starting to serve on 127.0.0.1:8001
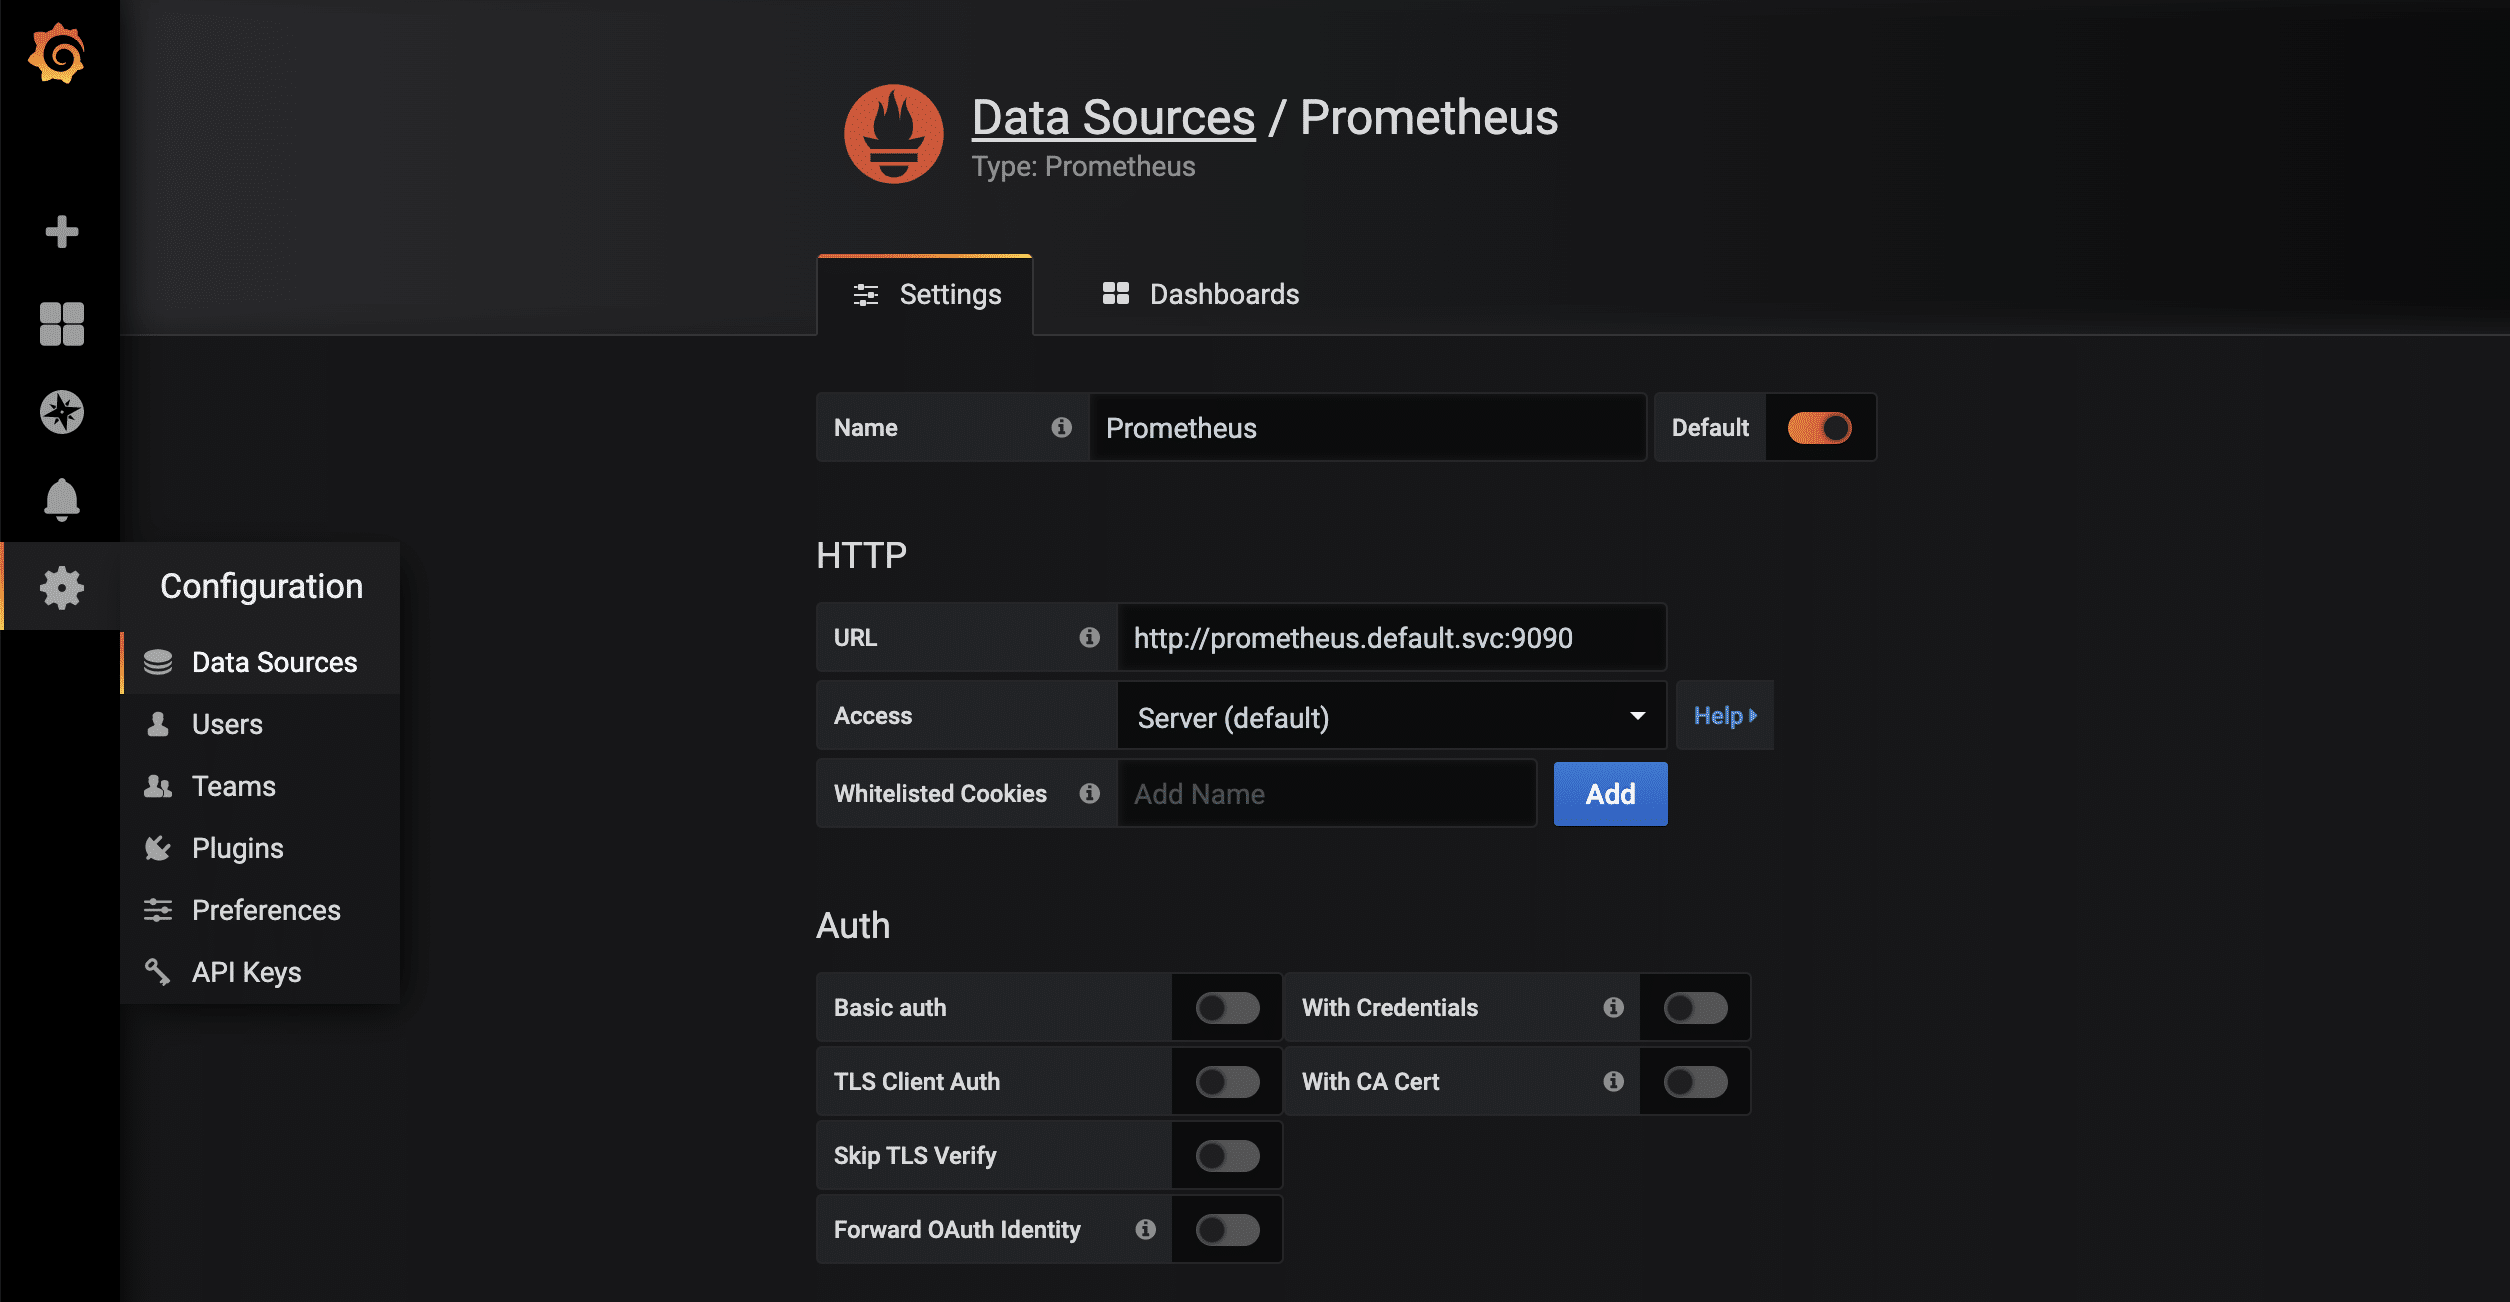
As soon as the proxy connection is available through kubectl, the started Grafana instance can be called up via http://localhost:8001/api/v1/namespaces/default/services/grafana/proxy/ in the browser. Only a few more steps are necessary so that the metrics available in Prometheus can now also be displayed in a visually appealing way. First, a new data source of the type Prometheus is created. Thanks to kubernetes’ own and internal DNS, the URL is http://prometheus.default.svc:9090. The schema is servicename.namespace.svc. Alternatively, of course, the cluster IP can also be used.
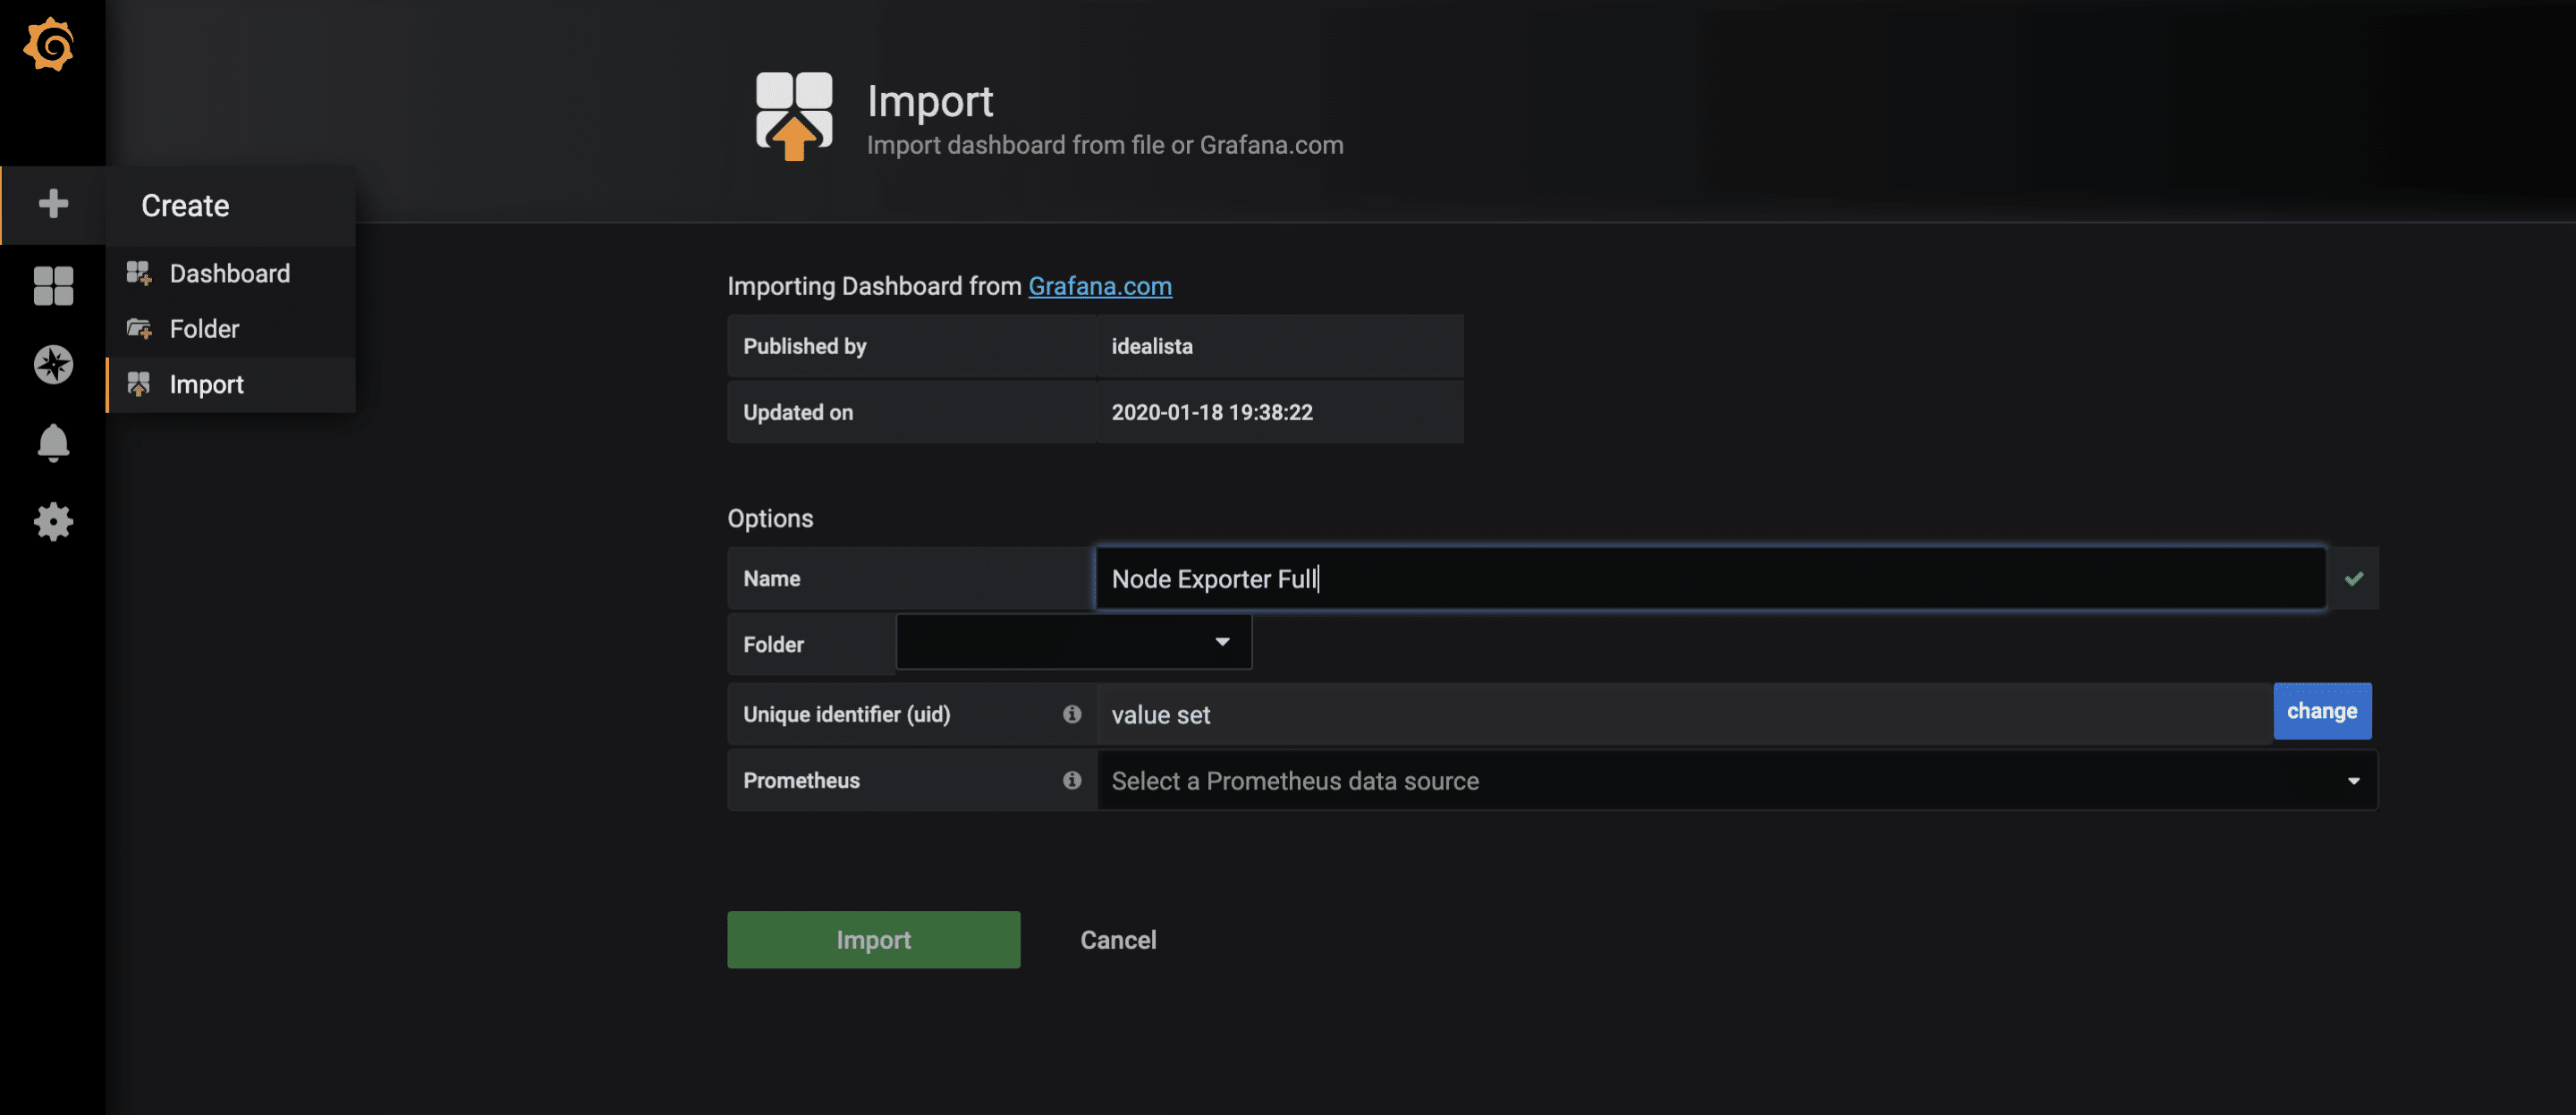
For the collected metrics of the node-exporter, there is already a very complete Grafana dashboard that can be imported via the import function. The ID of the dashboard is 1860.
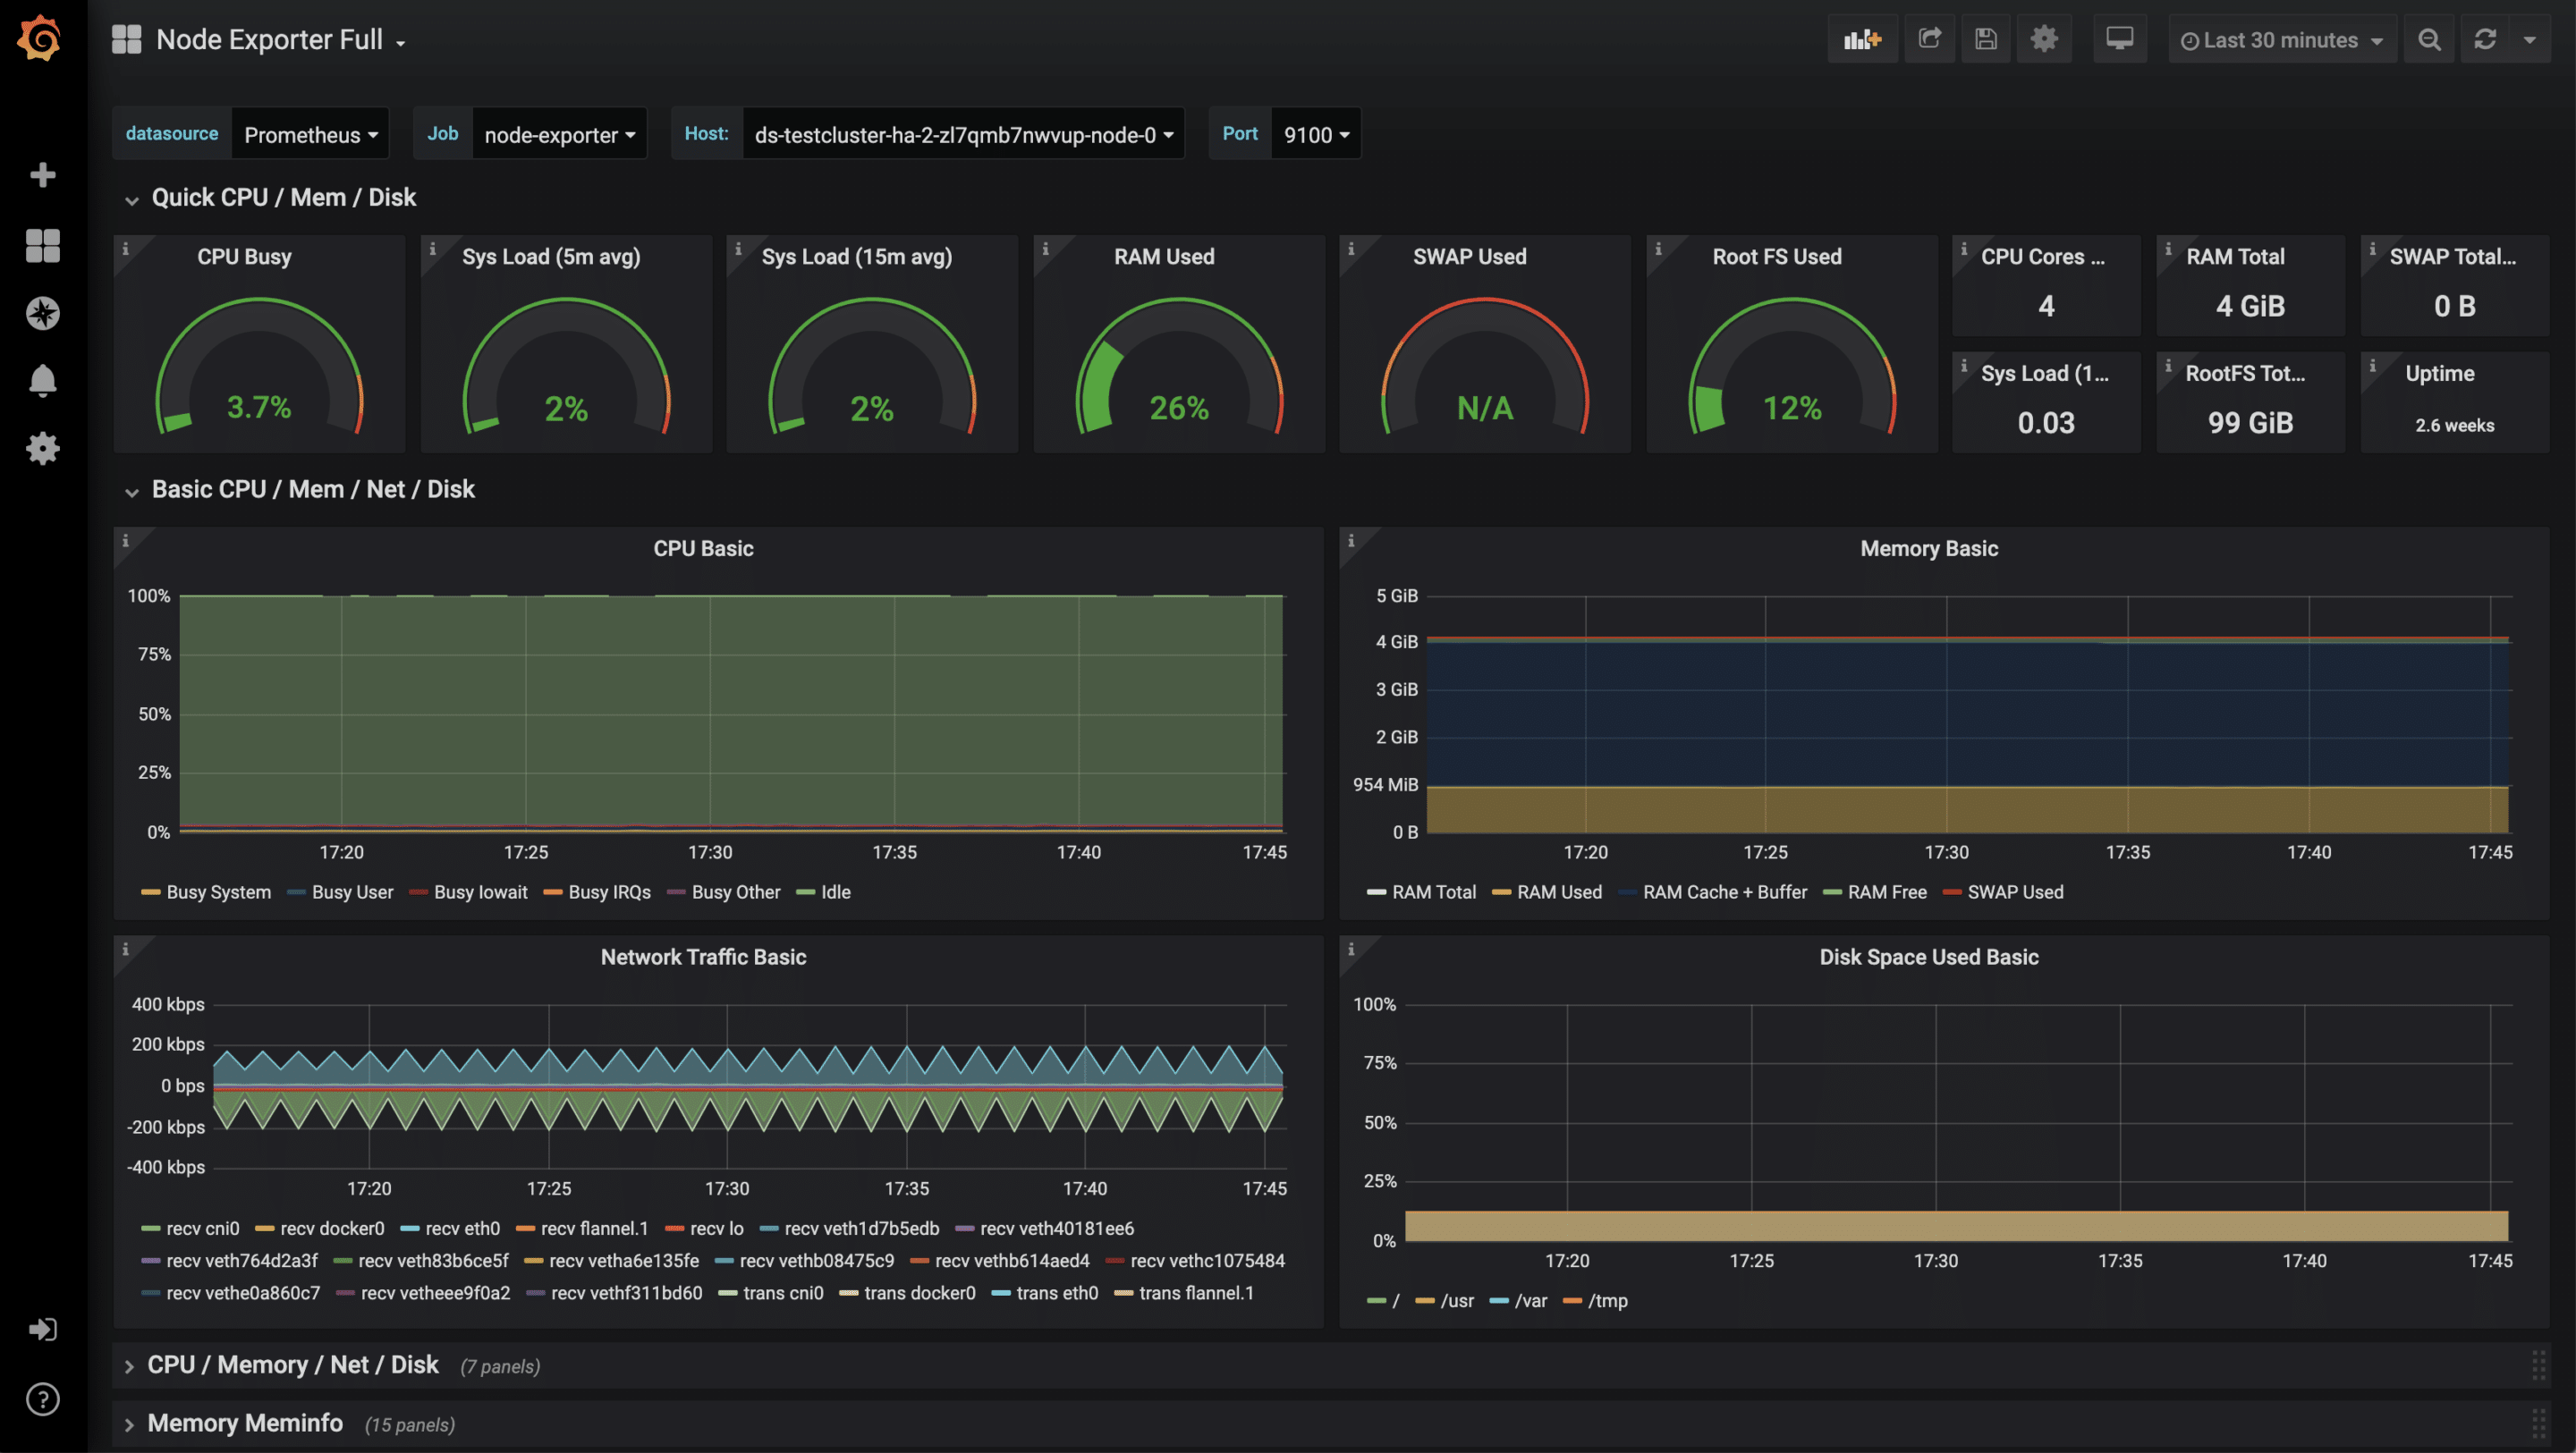
After the successful import of the dashboard, the metrics can now be examined.
Monitoring of further applications
In addition to these rather technical statistics, other metrics of your own applications are also possible, for example HTTP requests, SQL queries, business logic and much more. There are hardly any limits here due to the very flexible data format. To collect your own metrics, there are, as always, several approaches. One of them is to equip your application with a /metrics endpoint. Some frameworks such as Ruby on Rails already have useful extensions. Another approach are so-called sidecars. A sidecar is an additional container that runs alongside the actual application container. Together they form a pod that shares namespace, network, etc. The sidecar then runs code. The sidecar then runs code that checks the application and makes the results available to Prometheus as parseable values. Essentially, both approaches can be linked to the Prometheus operator, as in the example shown above.